Deliverable 2.1: Mapping of forest ecosystem services and institutional frameworks – Draft report
| Work package | WP2 Mapping and assessing forest ecosystem services and institutional frameworks | |||
|---|---|---|---|---|
| Deliverable nature | Draft Report | |||
| Dissemination level (Confidentiality) | PU (with RE appendix) | |||
| Estimated indicated person-months | 10´5 | |||
| Date of delivery | Contractual | 31.10.2018 | Actual | 29.10.2018 |
| Version | V1.0 | |||
| Total number of pages | 43 + Annexes | |||
| Keywords | Forest ecosystem services, mapping, CICES, institutional, innovation, governance, stakeholders, actors, rights, responsibilities | |||
List of Tables
- Table 1: List of provisioning FES (consistent with CICES version 4.3).
- Table 2: List of regulation/maintenance FES (consistent with CICES version 4.3).
- Table 3: List of cultural FES (consistent with CICES version 4.3).
- Table 4: Indicators (and data) proposed to map the supply of provisioning FES.
- Table 5: Indicators (and data) proposed to map the supply of regulation/maintenance FES.
- Table 6: Indicators (and data) proposed to map the supply of cultural FES.
- Table 7: List of the fourteen species analyzed.
- Table 8: Policy documents analysed for the database.
- Table 9: Forest ecosystem services in the analysed policy documents.
- Table 10: Innovations related to forest ecosystem services mentioned in the documents.
List of Figures
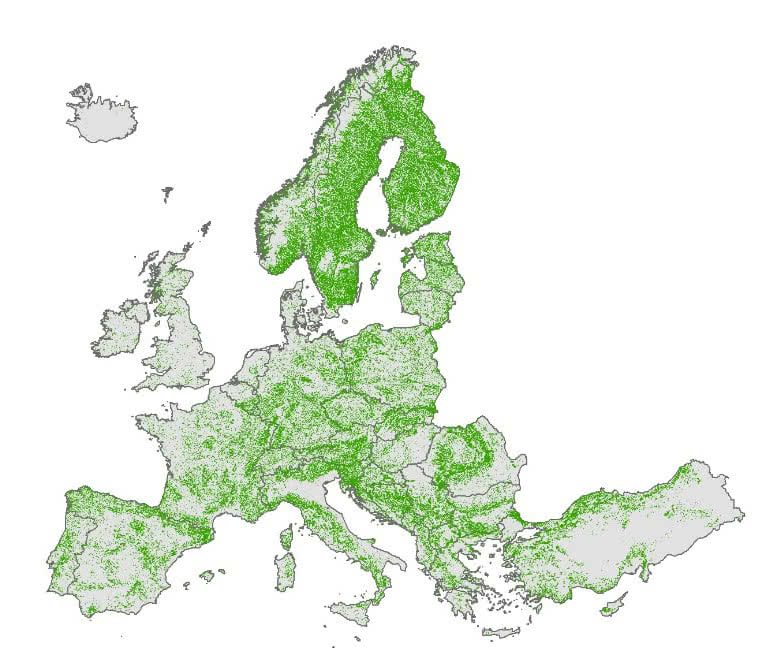
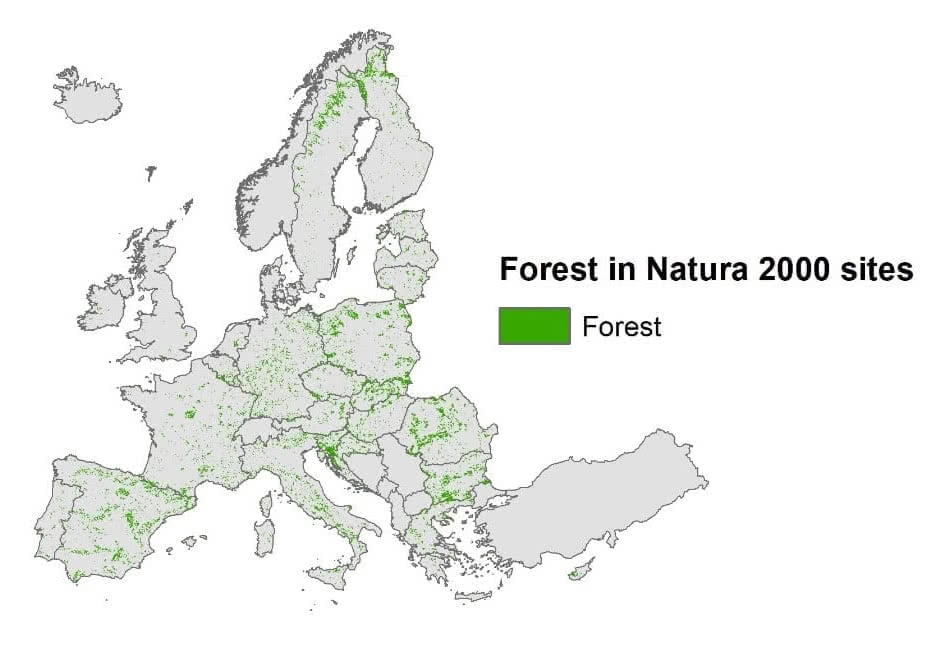
- Figure 1: European forests (classes 311, 312 and 313 of the CORINE database).
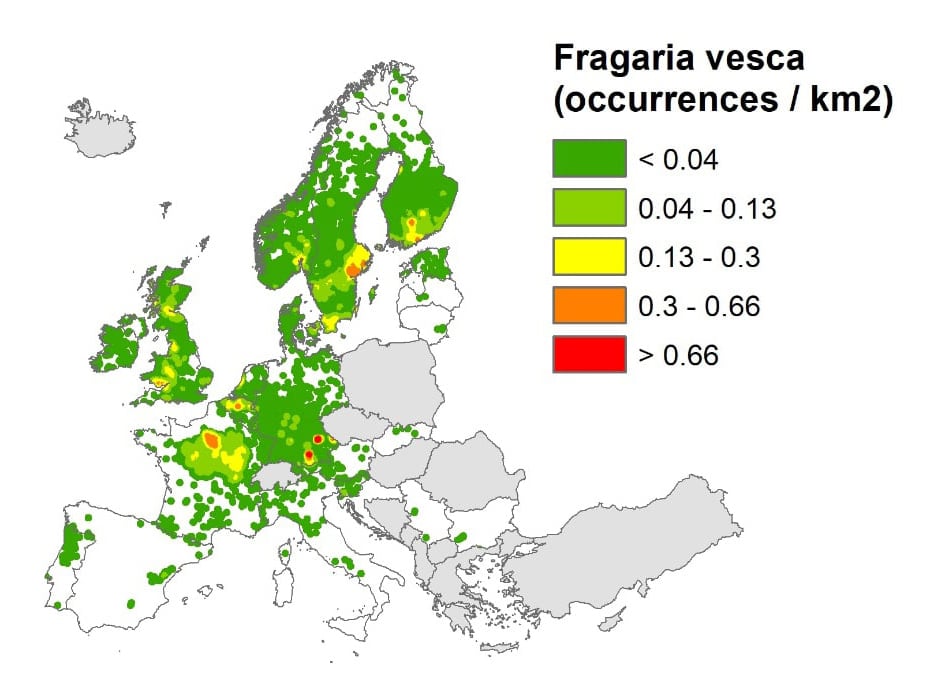
- Figure 2: Density of occurrences (occurrences km-2) of
Fragaria vesca (Wild strawberry). - Figure 3: Density of occurrences (occurrences km-2) of Boletus edulis (Penny bun).
- Figure 4: Density of occurrences (occurrences km-2) of Sus scrofa (Wild boar).
- Figure 5: Above-ground forest living biomass outside
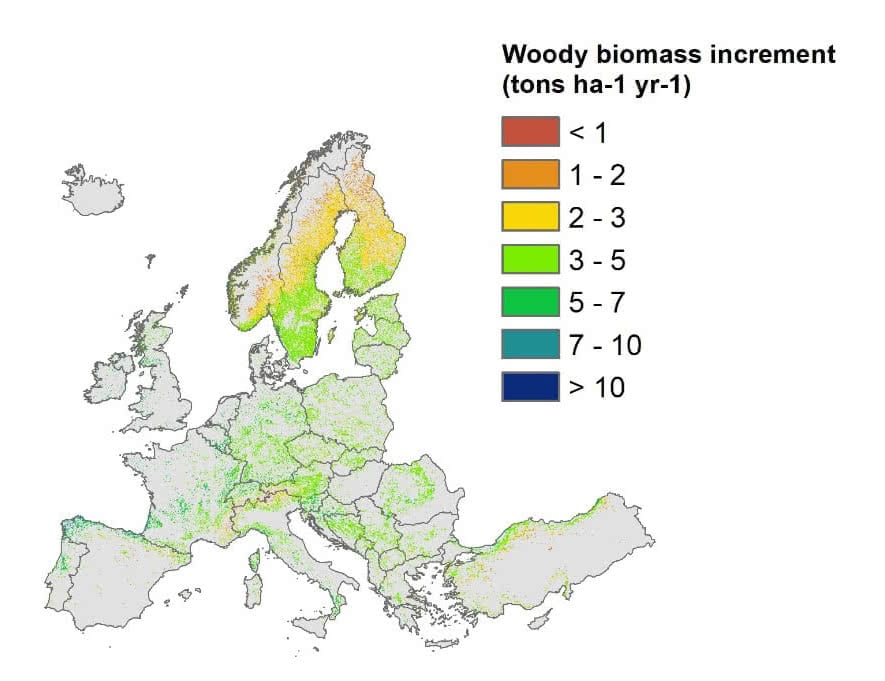
Natura 2000 sites (tons km-2). - Figure 6: Forest biomass increment (tons ha-1 yr-1) in European forests outside Natura 2000 sites.
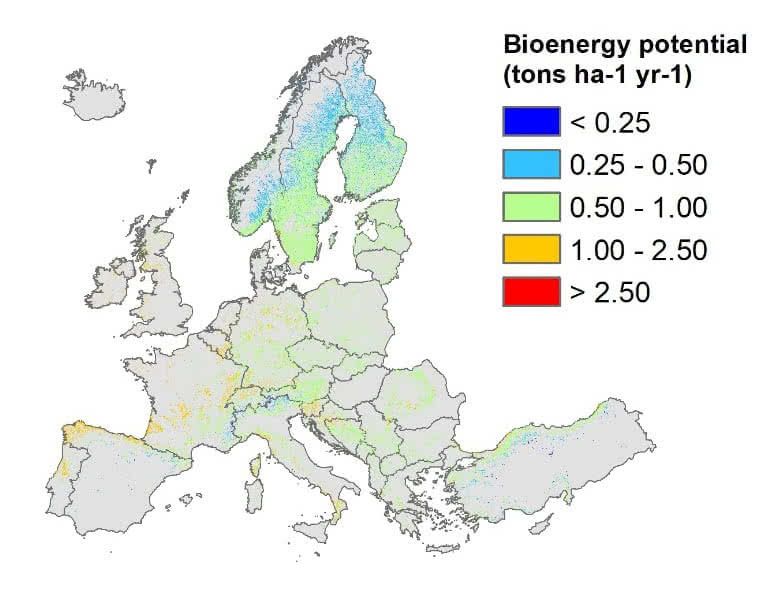
- Figure 7: Potential for bioenergy production expressed as a percentage of forest biomass increment (tons ha-1 yr-1).
- Figure 8: Forest on slopes steeper than 15 degrees.
- Figure 9: Relative Pollination Potential of European forests.
- Figure 10: Probability of cropland visitation by pollinator insects relying on forest edges as habitat.
- Figure 11: Habitat provision as forest cover in Natura 2000 sites.
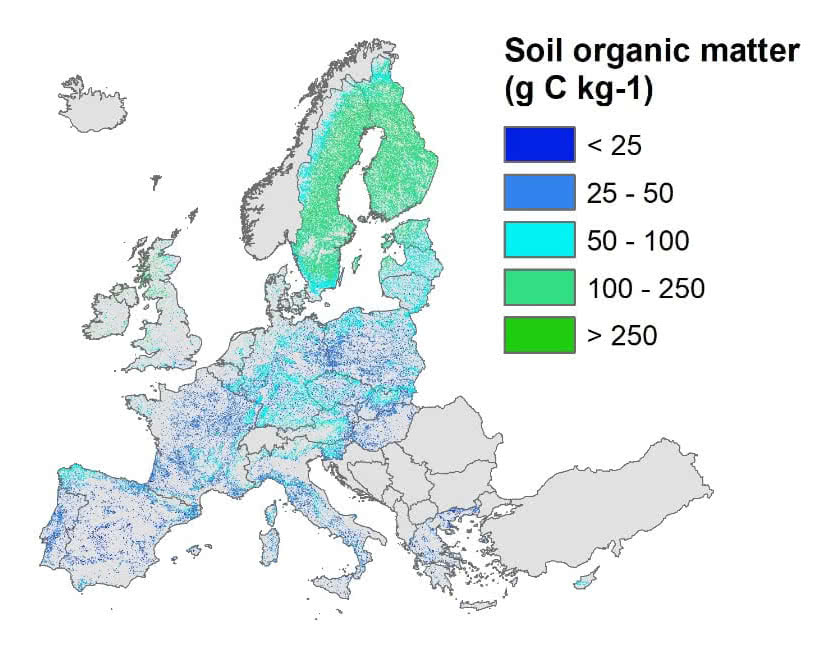
- Figure 12: Topsoil organic carbon (g C kg-1) in forested areas below 1000 meters of elevation.
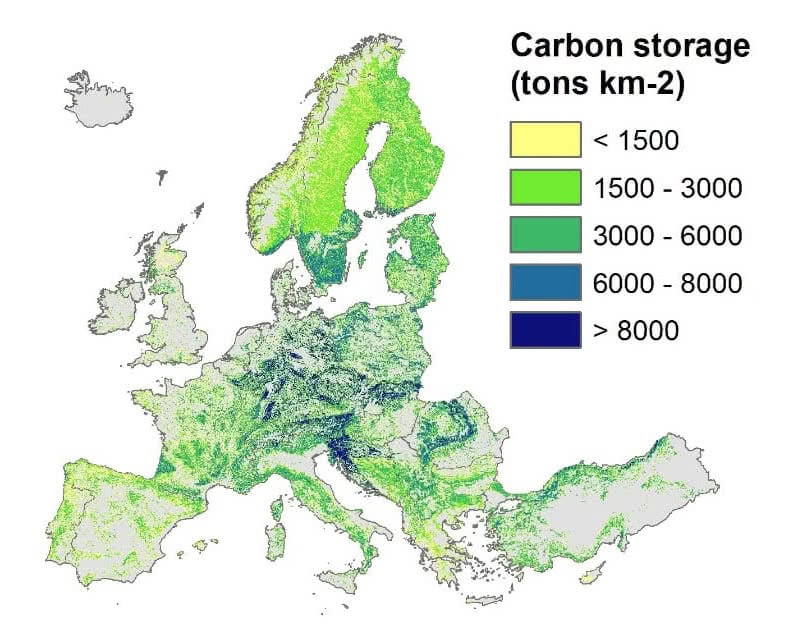
- Figure 13: Above-ground carbon stored in forests (tons km-2).
- Figure 14: Recreational Opportunity Spectrum (ROS) of European forests.
- Figure 15: Forest within and around (3-km buffer) natural and mixed UNESCO World Heritage Sites.
Abbreviations
| CICES | Common International Classification of Ecosystem Services |
| CS | Civil Society |
| ES | Ecosystem services |
| EU | European Union |
| FES | Forest Ecosystem Services |
| MAES | Mapping and Assessment of Ecosystems and their Services |
| NGO | Non-Governmental Organisation |
Executive summary
Promoting or upscaling governance and business innovations requires an understanding about the conditions and contexts that support a particular and successful innovation. Indeed, context can importantly condition the emergence of new ideas, their stabilization and system-level uptake. Ecosystems and the services they provide can be considered this kind of context for innovations because they vary across the landscape. Furthermore, the ways in which ecosystem services (ES) are governed can importantly condition new ideas. These institutional, structural and procedural conditions vary across different administrative units, for example countries or regions. As both ecological and institutional context matters for innovations in the forest sector, we capture these variations and provide a first basis for a more context-relevant analysis of innovation evolution, which potentially spurs new innovations. In general, there is a good spatial understanding of Europe’s forest ecosystem services (FES) but ecosystem service supply and demand have been matched only as rough estimates of scarcity. What is missing so far is a thorough analysis of the societal demand for FES, as expressed in policy.
We propose that societal demand can be derived from formal goals and argumentation in public strategies and laws, as these are the results of processes engaging societal actors and expertise. In the past years, several European policies have gradually taken up the notion of ES, and the European Forest Strategy fares well in its reference and integration of ES. However, what is missing is an analysis of the extent and the ways in which national forest related policies recognise FES and how this recognition coincides with ecosystem service supply at the spatial scale. By analysing how different EU, national and regional policies address forest ecosystem service relevant innovations, governance mechanisms and actors, we develop a deeper understanding of the biophysical-institutional landscape that can condition innovation in the forest sector. Based on the biophysical and institutional mapping, InnoForESt can identify niche innovations and their transferability, upscaling and further co-learning in comparative high potential context regions. This report describes the justification for mapping specific FES and policies and describes the methods applied in conducting the biophysical and institutional mapping as well as the initial findings.
The biophysical mapping of FES focused on the supply of ES and relied on simple mapping methods. The mapping process followed three main steps: 1) Identification of FES; 2) Definition of the indicators to map the selected FES; 3) Production of Pan-European maps. Given the European focus of the study, the identification of FES and definition of related indicators built on the CICES classification and the set of MAES indicators. Indicators were then refined based on the availability of adequate spatially-explicit data at the European level. A total of 11 indicators were eventually defined and maps produced for each of these. As maps of FES showed ES supply on a per unit area basis, the potential of a region or a country to provide a given FES requires considering the actual extent of forests in that region or country.
The institutional mapping was carried out to identify current and future policy demand for ES. The policy demand was analysed through detailed policy document analysis, for which a protocol and database were developed and iterated among the team. The initial document analysis conducted in 2018 covered the most relevant national or regional forest, biodiversity and bioeconomy strategies in the InnoForESt case study areas and at the EU level. The strategies represent context-sensitive and relatively dynamic policy documents that are made regularly, and can therefore be expected to reflect national or regional priorities and tackle new emerging issues, such as ES, innovations or new governance mechanisms. The document analysis was reported through an online survey that was used to produce a database. The document analysis focuses on ten FES, and included innovation type and stage, actor responsibilities and rights as well as new governance mechanisms. The initial findings reported in this draft report show that the documents identify innovations, actor roles and governance mechanisms in detail for those ecosystem services that they directly address but also other ecosystem services are recognised.
1 Introduction
For centuries the main goal of forestry was timber-production. Since the 1990s, minimizing environmental impacts and maximizing co-benefits have received more attention and forest governance has evolved to engage a greater number of stakeholders, shifting away from mere promotion of timber production. In this sense, forest policy has opened up to a broader set of stakeholders and responded to broader societal demands. Indeed, the integration of the multiple functions in forest governance is facing still further increasing demand for more diverse services provision, including climate regulation, risk management, food and energy production and biodiversity conservation (Winkel and Sotirov, 2016; EASAC, 2017). Society’s multiple demands on forest ecosystems call for new and innovative ways of governing and generating income from forests more sustainably. To achieve this, the forest sector needs to be more aware of the services that forest ecosystems can offer, more inclusive of different actors and approaches, and more open to new forms of forest governance.
Producing added value from forest ecosystems will have important implications on the rights and responsibilities of those people and organisations, who own, manage and use forests, such as private companies and states, and their responsibilities to forests. Aiming for a sustainability transformation in the forestry sector, and securing the provision of a broad range of forest ecosystem services (FES), our analysis has two objectives. First, we seek to increase the understanding of FESs supply using spatial analyses at the European scale. Second, we aim to develop an approach for mapping and conduct initial analyses of the formal policy demand or readiness for forest ecosystem service innovations, including reconfigurations of actors’ rights and responsibilities, and new governance mechanisms in a set of EU countries.
Transferring or upscaling innovations requires an understanding about the conditions and contexts that support a particular and successful innovation. Indeed, context can importantly condition the emergence of new ideas, their stabilization and system-level uptake (Geels 2002; Purkus et al., 2018). Ecosystems and the services they provide can be considered this kind of context for innovations (de Groot et al., 2010; Haines-Young and Potschin, 2011). Furthermore, the ways in which ecosystem services are governed can importantly condition new ideas (Loft et al., 2015; Primmer et al., 2015). However, these biophysical, institutional, structural and procedural conditions vary across the landscape and particularly across different administrative units (Ruhl, 2016). As both ecological and institutional context matters for innovations in the forest sector, we capture these variations and provide a first basis for a more context-relevant analysis of innovation evolution, which potentially spurs new innovations.
In general, there is a good spatial understanding of Europe’s forest ecosystem services (Maes et al., 2012), but ecosystem service supply and demand have been matched only as rough estimates of scarcity (Burkhard et al., 2012). What is missing so far is a thorough analysis of the policy demand for FES. We propose that medium term societal demand could be derived from formal goals and argumentation in public strategies, as these are often the results of processes engaging societal actors and expertise (Hajer and Wagenaar, 2003; Bunea, 2017). In the past years, several European policies have gradually taken up the notion of ecosystem services (Bouwma et al., 2018). In particular, the European Forest Strategy fares well in comparison to other sector policies in its reference and integration of ecosystem services. However, what is missing is an analysis of the extend and ways in which national forest related policies recognise forest ecosystem services and how this recognition coincides with ecosystem service supply at the spatial scale. By analysing how these different EU, national and regional policies address different forest relevant innovations, governance mechanisms and actors, a deeper understanding of the biophysical-institutional landscape that can condition innovation in the forest sector is developed.
This Deliverable is a draft report of Work Package 2 of the InnoForESt project (Smart information, governance and business innovations for sustainable supply and payment mechanisms for forest ecosystem services; GA no. 763899). The objectives of this WP are to a) take stock the social-ecological landscape of Europe, and b) compile the technical and institutional landscape influencing innovations for forest management and ecosystem services provision in form of maps and databases. This report is a basis for supporting other work packages within the InnoForESt project (WP3: smart ES governance innovations, WP4: innovation platforms for policy and business, WP5: innovation process integration). Based on this work, InnoForESt will identify niche innovations for further co-learning, by analysing the socio-economic and institutional conditions for traditional technological and business innovations, opportunities in the emerging non-timber forest products-based bio-economy (Kleinschmit et al., 2014) as well as new policy instruments such as Payments for Ecosystem Services (PES) and habitat banking (Primmer et al., 2013; Mann et al., 2015). This report describes the justification for mapping specific forest ecosystem services and policies and describes the methods applied in conducting the spatial and institutional mapping as well as the initial findings. The following sections consists of two main parts: 2.1 Ecosystem services mapping (biophysical mapping) and 2.2 Institutional mapping (document analysis), each outlining data collection and methods for the respective task, which is followed by a preliminary analysis.
2 Biophysical ecosystem services mapping
2.1 Methods and data
Ecosystem services (ES) maps are a valuable tool to support decisions that may affect their delivery and/or their enjoyment. In particular, ES maps can be used to identify areas that are crucial for supply, namely the provision of a service by ecosystems; demand, namely the need for a service by society; and flow, namely the mobilization of a service between a producing site and a benefiting site in a given time (Burkhard et al., 2014). Such information could then be used, for example, to develop sustainable landscape plans, design nature-based solutions, assess the dependence of a region on ES produced elsewhere or estimate the role played by a region in guaranteeing ES to one or more regions. In order for ES maps to convey useful information, they must be based on appropriate ES indicators and be produced according to reliable mapping methods. Several mapping methods can be used, from the simplest (e.g. links between ES and land cover) to the more complex (e.g. quantitative regression and modelling combining field and spatial data). One way to navigate through these methods and choose a suitable method is to rely on a tiered approach, by which questions about the understanding of processes (should physical and social processes be thoroughly understood?), the detail of the mapping output (should the map provide rough or detailed information?) and the information required by decision-makers (does the action require information on the system behaviour?) determine whether a basic mapping method (Tier 1), predominantly involving map overlay and direct extraction of ES information from land use/land cover maps, or more advanced methods (Tier 2 and Tier 3), based on increasingly complex modelling, are to be preferred (Grêt-Regamey et al., 2017). The selection of a mapping method is also related to data availability, the cost of generating high-resolution information and the size of the study area, with poorer data availability, higher cost and larger size going hand in hand with lower tier mapping methods.
The biophysical mapping of Forest Ecosystem Services (FES) conducted in this project focused on the supply of ES and relied on Tier 1 mapping methods. This latter aspect is consistent with the stock-taking nature of the mapping task, as per project’s goals. The mapping process followed three main steps:
- Identification of FES;
- Definition of the indicators to map the selected FES;
- Production of Pan-European maps.
2.1.1 Identification of FES
The selection of ES that are as explanatory as possible about the range of benefits forests provide to people requires the adoption of an ES classification that is both comprehensive and widely agreed upon. Building on various classification schemes, such as the Millennium Ecosystem Assessment (MA, 2005) and the Economics of Ecosystems & Biodiversity initiative (TEEB, 2010), the Common International Classification of Ecosystem Services (CICES) has been developed under the coordination of the European Environment Agency (Haines-Young and Potschin, 2013). CICES is used to frame both research and policy and provides a meaningful standardization in the way ES are described. While CICES does not fully consider biodiversity/habitat issues compared to the MA and TEEB, it was preferred to these for being the classification scheme according to which the EU flagship initiative on Mapping and Assessment of Ecosystems and their Services (MAES) was conducted.
CICES classifies ES using a five-level hierarchical structure, where each level is progressively more specific. The five levels are:
- Section: main category of ES (i.e. provisioning, regulation/maintenance, cultural)
- Division: main type of output or process (e.g. nutrition, materials, etc.)
- Group: biological, physical or cultural type or process (e.g. biomass, water, etc.)
- Class: biological or material outputs and bio-physical and cultural process that can be related to service sources (e.g. cultivated crops, bio-remediation by micro-organisms, etc.)
- Class type: individual entities envisaging ways to measure the associated service output (e.g. crops by amount, bio-remediation by amount or type, etc.)
The set of FES to be mapped under this task in the InnoForESt project was defined starting from all classes (and class types) listed in the CICES classification scheme, and retaining those representing ES of which the forest biome is a major provider. This iteration included coordination with the institutional mapping analysing European policies. The set was checked for consistency and comprehensiveness against the summary table of FES included in the second report of the Mapping and Assessment of Ecosystems and their Services (MAES) initiative (EC, 2014), which was drafted according to CICES version 4.3. The selected FES for provisioning, regulation/maintenance and cultural ES are presented in the CICES format in Table 1, Table 2 and Table 3, respectively.
| Division | Group | Class | Class type |
|---|---|---|---|
| Nutrition | Biomass | Wild plants | Plants by amount, type |
| Wild animals (game) | Animals, by amount, type | ||
| Water | Surface water for drinking | Amount of water | |
| Materials | Biomass | Wood for direct use or processing | Material by amount and type |
| Energy | Biomass-based | Bioenergy | By amount, type, source |
| Division | Group | Class | Class type |
|---|---|---|---|
| Mediation of waste, toxics and other nuisance | Mediation by ecosystems | Filtration/sequestration by ecosystems | By amount, type, use, media (land, soil) |
| Mediation of flows | Mass flows | Mass stabilization and control of erosion rates | By reduction in risk, area protected |
| Liquid flows | Water flow regulation/maintenance | By depth, volumes | |
| Maintenance of physical, chemical, biological conditions | Lifecycle maintenance, habitat and gene pool protection | Pollination and seed dispersal | By amount and source |
| Habitat maintenance/protection | By amount and source | ||
| Soil formation and compositions | Decomposition and fixing processes | By amount/concentration and source | |
| Atmospheric composition and climate regulation | Global climate regulation by reduction of greenhouse gas concentration | By amount, concentration or climate parameter |
| Division | Group | Class | Class type |
|---|---|---|---|
| Physical and intellectual interactions with biota, ecosystems, and land/seascapes | Physical and experiential interactions | Experiential use of the forest. | By visits/use data, plants, animals, ecosystem type |
| Physical use of the forest | By visits/use data, plants, animals, ecosystem type | ||
| Spiritual, symbolic and other interactions with biota, ecosystems, and land-/seascapes | Spiritual and/or emblematic | Symbolic and sacred and/or religious | By use, plants, animals, ecosystem type |
2.1.2 Definition of indicators
Indicators used to map the selected FES were defined starting from the set of indicators proposed in the second MAES report (EC, 2014), which was refined based on the availability of adequate spatially-explicit data at the European level. In particular, data had to be characterized by large enough spatial coverage (i.e. at least the EU, possibly the entire Europe), reasonably high resolution (e.g. in case of raster maps, a resolution of at least 1 km, possibly 100 m) and free distribution by public agencies (e.g. European Commission). Given the stock-taking nature of the mapping task and the large extent of the study area, indicators were defined so as to require relatively simple analysis of existing data (Tier 1 mapping).
The indicators were selected to describe the supply of ES, namely the capacity of an area to provide ES within a given time period (Burkhard et al., 2012), rather than the flow or demand, which are addressed more through the document analysis. These biophysical indicators could then be used to generate maps conveying accurate information about which areas are key providers of specific FES in Europe and allowing for the comparison of different areas in terms of their ability to supply important FES. Proposed indicators are presented in Tables 4-6, which also report details about data available to assess them. Cells highlighted in grey present ES of which forests are major/important providers, but for which data were not available.
| Division | Group | Class | Indicator (unita) | Data (unita) | Data typeb | Data provider |
|---|---|---|---|---|---|---|
| Nutrition | Biomass | Wild plants | Presence of plants and mushrooms (# km-2) | Species occurrences (-) | Occurrences | Global Biodiversity Information Facility (www.gbif.org) |
| Wild animals (game) | Presence of game species (# km-2) |
Species occurrences (-) | Occurrences | Global Biodiversity Information Facility (www.gbif.org) | ||
| Water | Surface water for drinking | |||||
| Materials | Biomass | Wood for direct use or processing | Forest biomass stock (tons km-2) |
Above-ground forest living biomass (tons km-2) |
Raster dataset (1-km) |
JRC |
| Forest biomass increment (tons ha-1 yr-1) |
Above-ground woody forest biomass increment (tons ha-1 yr-1) |
Raster dataset (1-km) |
JRC | |||
| Energy | Biomass-based | Bioenergy | Fraction of forest biomass increment for energy production (tons ha-1 yr-1) | Above-ground woody forest biomass increment (tons ha-1 yr-1) |
Raster dataset (1-km) |
JRC |
b Data can be of three types: occurrences (i.e. x and y coordinates), polygon shapefile or raster. In this latter case, resolution is reported in parentheses.
| Division | Group | Class | Indicator (unita) |
Data (unita) |
Data typeb |
Provider |
|---|---|---|---|---|---|---|
| Mediation of waste, toxics and other nuisance | Mediation by ecosystems | Filtration/ sequestration by ecosystems | By amount, type, use, media (land, soil) | |||
| Mediation of flows | Mass flows | Mass stabilization and control of erosion rates | Forest on steep slopes (-) | Forest cover (-) | Raster dataset (100-m) | Copernicus (CORINE) |
| DEM (m) | Raster dataset (25-m) | EEA (EU-DEM) | ||||
| Avoided soil erosion in forested areas (tons yr-1) | Avoided soil erosion (tons yr-1) | Raster dataset (100-m) | JRC | |||
| Forest cover (-) | Raster dataset (100-m) | Copernicus (CORINE) | ||||
| Liquid flows | Water flow regulation/maintenance | Water retention potential (-) | Various datasets (e.g. leaf area index, slope, etc.) | Raster datasets (100-m) | JRC | |
| Maintenance of physical, chemical, biological conditions | Lifecycle maintenance, habitat and gene pool protection | Pollination and seed dispersal | Pollination potential | Relative pollination potential (-) | Raster dataset (100-m) | JRC |
| Visitation probability in cropland by bees living in forest (%) | Land use (-) | Raster dataset (100-m) | Copernicus (CORINE) | |||
| Habitat maintenance/protection | Forest on Natura 2000 sites (-) | Forest cover (-) | Raster dataset (100-m) | Copernicus (CORINE) | ||
| Natura 2000 (-) | Polygon shapefile | EEA | ||||
| Soil formation and compositions | Decomposition and fixing processes | Soil organic matter (g C kg-1) | Topsoil organic matter (g C kg-1) |
Raster dataset (500-m) | JRC | |
| Atmospheric composition and climate regulation | Global climate regulation by reduction of greenhouse gas concentration | C storage in forests (tons km-2) |
Forest above-ground carbon (tons km-2) | Raster dataset (1-km) | JRC |
b Data can be of three types: occurrences (i.e. x and y coordinates), polygon shapefile or raster. In this latter case, resolution is reported in parentheses.
| Division | Group | Class | Indicator (unita) |
Data (unita) |
Data typeb |
Provider |
|---|---|---|---|---|---|---|
| Physical and intellectual interactions with biota, ecosystems, and land/seascapes | Physical and experiential interactions | Experiential use of the forest | Recreation potential of forests (-) | Recreational Opportunity Spectrum (-) | Raster dataset (100-m) | JRC |
| Physical use of the forest | ||||||
| Spiritual, symbolic and other interactions with biota, ecosystems, and land-/seascapes | Spiritual and/or emblematic | Symbolic and sacred and/or religious | Forest in and around heritage sites (-) | Forest cover (-) | Raster dataset (100-m) | Copernicus (CORINE) |
| Heritage sites (-) | Polygon shapefile | UNESCO |
b Data can be of three types: occurrences (i.e. x and y coordinates), polygon shapefile or raster. In this latter case, resolution is reported in parentheses.
2.1.3 Production of Pan-European maps
This section describes how maps for each FES were created.
Presence of plants, mushrooms and game
The maps were intended to provide information about where certain forest-related species can be found, and to quantify the probability of finding them. This was achieved following the method proposed by Schulp et al. (2014b), who mapped the occurrences of various species within a study area and then computed, at each location throughout the study area, the number of occurrences within a radius of 25 km. The analysis focused on a total of fourteen commonly collected and consumed forest-related species, as suggested by Schulp et al., 2014b: seven commonly collected and consumer wild plant species, four mushroom species and three game species (Schulp et al., 2014b; Table 7).
| Type | Binomial name | Common name |
|---|---|---|
| Wild plant | Allium ursinum | Wild garlic |
| Cornus mas | European cornel | |
| Fragaria vesca | Wild strawberry | |
| Humulus lupulus | Common hop | |
| Lathyrus tuberosus | Tuberous pea | |
| Rubus idaeus | Raspberry | |
| Urtica dioica | Stinging nettle | |
| Mushroom | Boletus edulis | Penny bun |
| Cantharellus cibarius | Chanterelle | |
| Lactarius deliciosus | Saffron milk cap | |
| Pleurotus ostreatus | Oyster mushroom | |
| Game | Capreolus capreolus | Roe deer |
| Cervus elaphus | Red deer | |
| Sus scrofa | Wild boar |
Occurrences in table format were converted into shapefiles and subsequently 1-km raster datasets. Neighbourhood analyses were run on the above-mentioned raster datasets to count the number of occurrences within a 25-km radius around each cell (Schulp et al., 2014). The results of these analyses were finally converted into density maps reporting the number of occurrences per square km. The fourteen resulting maps (i.e. one per species), which have a 1-km resolution, provide detailed information only for countries with a sufficient number of reported occurrences.
Biomass
Biomass was mapped as the above-ground forest living biomass (tons km-2) (Barredo Cano et al., 2012) and forest biomass increment (tons ha-1 yr-1) (Busetto et al., 2014) in non-protected areas, namely outside Natura 2000 sites, assuming that wood harvesting is not allowed within those areas. This is in fact a very conservative assumption, as harvesting may be possible within protected areas, provided it does not take place in core areas. However, as policies vary significantly from country to country, and possibly from area to area, the proposed assumption sets a general precautionary vision recognizing the existence of constraints on forest exploitation in protected areas. Both maps have a 1-km resolution.
Bioenergy
The bioenergetic potential of forest ecosystems was estimated as the amount of forest biomass that can be used for energy production according to the following assumptions:
- only the biomass increment is available for exploitation;
- no harvest is allowed in protected areas (i.e. Natura 2000 sites);
- on average, 20% of the forest increment is available for energy production as proposed by Zambelli et al. (2012) and Sacchelli et al. (2013).
As suggested before, the second assumption may not hold everywhere, but it is a precaution intended to recognize that new extraction of woody biomass for energy production may be limited in protected areas (definitely in their core areas). The third assumption is an attempt at setting an average percentage, although the proportion of woody biomass used for bioenergy may be lower or higher depending on the country. The map of biomass increment (tons ha-1 yr-1) was obtained from the work of Barredo Cano et al., 2012. The resulting map has a 1-km resolution.
Mass stabilization and control of erosion rates
The soil stabilization service provided by forests was mapped in two ways: a direct one, quantifying the magnitude of the service provided, and an indirect one, recognizing the role played by forests in the stabilization of slopes. The direct approach involved the overlay of a forest cover map and a map reporting avoided soil erosion owing to the presence of vegetation (tons of soil yr-1) as obtained by application of the RUSLE method (JRC, 2010; Guerra et al., 2016). The indirect approach involved the overlay of a forest cover map and a slope map (derived from a DEM) to identify steep areas (e.g. > 15° slope) covered by forest. Both maps have a 100-m resolution.
Water retention potential
Analyses aimed at generating a map about the water retention service provided by forests are still ongoing.
Pollination potential
The pollination service was mapped as the relative capacity of ecosystems to support crop pollination and the probability that bees living in the forest edge visit nearby cropland. The first mapping approach was based on the map of relative pollination potential produced by the JRC (Zulian et al., 2013).
The second approach implied a more complex analysis and was partly based on Schulp et al. (2014a). Forest edges were extracted from the CORINE land cover map as forest cells within 100 m from non-forest cells. Visitation probability in cropland was computed by applying the following formula (Schulp et al., 2014a):
Visitation probability = exp(-0.00104 * dist_forest_edge)
Habitat maintenance/protection
The habitat protection function of forests was mapped by overlaying Natura 2000 sites with forest cover as extracted from the CORINE database. Habitat maintenance and protection occur also outside protected areas, but as the Natura 2000 network is specifically aimed at ensuring the survival of Europe’s most valuable species and habitats, we can assume that forests in Natura 2000 sites specifically provide this ES (Birds Directive and the Habitats Directive). The resulting map has a 100-m resolution.
Soil organic matter
The content of carbon in soils was mapped using predicted topsoil organic carbon content (g C kg-1) estimated by the European Soil Data Centre (ESDAC) of the JRC. The dataset was produced by applying a generalized additive model that considers organic carbon measurements from the LUCAS survey as the dependent variables and slope, land cover, annual accumulated temperature, net primary productivity, etc. as the independent variables (https://data.jrc.ec.europa.eu/dataset/jrc-esdac-86). The resulting map has a 500-m resolution.
Carbon storage
The carbon content of forests has been mapped using data on above-ground carbon content as estimated by the JRC (Barredo et al., 2012). Such estimates were obtained by considering the forest cover map (with distinction between coniferous and broadleaved forest types) and the map of ecological zones (FAO; 2001), and applying a series of conversion factors (i.e. average amount of biomass in forest per ecological zone, ratio of below ground to above ground biomass per ecological zone, carbon fraction of forest biomass) on them. Conversion factors had been derived from the IPCC report on Guidelines for National Greenhouse Gas Inventories (IPCC, 2006). The resulting map has a 1-km resolution.
Experiential and recreational use
The experiential and recreational use of the forest, intended as the range of recreational opportunities offered by the forest, was mapped by overlaying the forest map extracted from the CORINE land cover with the map of the Recreational Opportunity Spectrum (ROS) produced by the JRC (Maes, 2010; Paracchini et al., 2014). ROS estimates the recreation potential of an area by means of two variables: provision of recreational opportunities and proximity to residential areas. As three classes are considered for each variable, ROS encompasses a total of nine classes of recreation potential: low provision – easy accessible (1), low provision – accessible (2), low provision – not accessible (3), medium provision – easy accessible (4), medium provision – accessible (5), medium provision – not accessible (6), high provision – easy accessible (7), high provision – accessible (8), high provision.- not accessible (9). The resulting map has a 100-m resolution.
Symbolic value
The symbolic value of the forest was mapped as the presence of forests in and around cultural and natural heritage sites. The location and shape of natural (i.e. natural areas showing outstanding geological and biological elements/processes and/or elements of exceptional beauty) and mixed (i.e. sites presenting elements of both natural and cultural value) heritage sites were obtained from the UNESCO website as a polygon shapefile. Buffers of 1, 2 and 3 km around heritage sites were created and overlaid with a map of forest cover extracted from the CORINE database. Selected radii (i.e. 1, 2, 3 km) are expected to define reasonable buffer areas for the protection of the heritage sites. Resulting maps have a 1-km resolution.
2.2 Results of the biophysical mapping
European forests are mapped in Figure 1 as classes 311 (broad-leaved forest), 312 (coniferous forest) and 313 (mixed forest) of the CORINE database. The map highlights how Scandinavian Countries (particularly Sweden and Finland), Baltic countries, the Pyrenees, the Alps and the Carpathians host the largest extents of continuous forest cover. As maps of FES presented below report ES supply on a per unit area basis (e.g. tons km-2), the potential of a region or a country to provide a given FES can only be estimated by considering the actual extent of forests in that region or country according to Figure 1. Considerations about forest extent are particularly useful to avoid interpretation errors when per unit area FES supply is higher in regions characterized by scattered forest cover than it is in regions characterized by large continuous forests, e.g. when per unit area ES supply is inversely related to latitude or altitude. Northern areas and areas at high elevation have more forest cover but less volume and growth. The combined analysis of per unit area FES supply and forest cover as reported in Figure 1 may also help detect areas where the provision of FES is scarce and provision per unit might be more valuable because of this scarcity, or areas where intense forest fragmentation may threaten the provision of FES in the medium to long run. Figure 1 allows also the detection of areas of large extents of forest cover, which can be meaningful for the provision of some FES. In particular some species depend on large non-fragmented areas but also carbon storage, water regulation or recreation can benefit from continuous forested areas tracts.
An example of the maps produced to show the supply of wild forest plants in Europe is presented in Figure 2, which depicts the density of occurrences of Fragaria vesca (Wild strawberry) (countries with scarce or missing data are shown in grey). As stated in section 2.1.1.3, data were not available for all countries, resulting in total or partial lack of information for Southern and Eastern Europe. Supply hotspots could be recognised in Northern France, Scotland and Western England and the South of Sweden and Finland.
An example of the maps produced to show the supply of wild mushrooms in Europe is presented in Figure 3, which depicts the density of occurrences of Boletus edulis (Penny bun) (countries with scarce or missing data are shown in grey). Data were essentially missing or scarce everywhere, except in Germany, UK and Scandinavia. Yet this map can provide some initial ideas for innovations or policy orientation. Supply hotspots in this case appeared in Denmark and Southern Sweden, as well as Scotland and Southern England.

An example of the maps produced to show the supply of game species in Europe is presented in Figure 4, which depicts the density of occurrences of Sus scrofa (Wild boar) (countries with scarce or missing data are shown in grey). Data were mostly available for Spain, Germany and Sweden, and hotspots of supply appeared in small parts of these countries.

The overall biomass content of European forests is mapped in Figure 5, showing the amount of above-ground forest living biomass per unit area (tons km-2) outside Natura 2000 sites. The map shows that areas supplying the highest amounts of biomass per unit area (> 15,000 tons km-2) are scattered across Central, South central and Eastern Europe, particularly in Germany, Austria, Poland, Croatia and Romania. Areas characterized by mid to high supply of biomass (10,000 – 15,000 tons km-2) are Southern France, the Alps, the Apennines in Italy, the Eastern Balkans, Southern Sweden, Baltic countries and Northern Turkey. Central and Western Balkans, and particularly Central Sweden and Finland present very large extensions of forests in the medium and low classes of per unit area biomass supply.

The potential for biomass production is mapped in Figure 6, which shows forest biomass increment (tons ha-1 yr-1) in European forests excluding Natura 2000 sites. In general, per unit area biomass increment tends to be higher in temperate areas and lower in boreal areas. Both latitude and elevation contribute to this outcome, as emphasized by lower values in Northern Scandinavia and the Alps. The vast majority of European forests increase their biomass content by 3 to 5 tons per hectare per year, whereas Northern Scandinavian forests mostly fall in the 1-3 tons per hectare and year range
The amount of biomass increment that can be devoted to energy production (tons ha-1 yr-1) is mapped in Figure 7. Regions having the highest bioenergy potential per unit area (more than 1 ton of biomass per hectare per year) are: Northern Spain, Southern Italy, Central France, Southern Belgium, Switzerland and Southern Germany and Slovenia. Overall, given the extent of their forested areas, Scandinavia (particularly Sweden and Finland), the Baltic countries, Germany, Poland, Austria, Slovakia, Czech Republic and Bosnia-Herzegovina are the greatest reservoir of timber for energy production.
The mass stabilization service of forests is mapped in Figure 8, which shows forests on slopes steeper than 15 degrees. As expected, the service is predominantly supplied in the big European mountain ranges: the Pyrenees, the Alps, the Apennines, the Balkans, the Carpathian Mountains.

The ability of forests to support wild pollinator insects is mapped in Figure 9, which shows the Relative Pollination Potential (RPP) of forested areas. As forest edges, rather than forest cores, constitute the most suitable habitat for pollinators, the value of the RPP index is particularly high in heavily fragmented forests, where the density of edges is very high. In general, forests in South-central Europe have the highest potential to support pollinator insects.

A flipped perspective on the role of forests in pollination is presented in Figure 10, which shows the probability that pollinator insects relying on forest edge habitat visit nearby cropland. The largest concentration of areas characterized by high visitation probability (> 50%) is found in regions hosting a mix of forests and cropland so that the distance between the two elements is hardly considerable. This is the case of central Europe and the Baltic countries. Flat or semi-flat areas adjacent to hilly and mountainous terrain covered by forests (e.g. along the Italian Apennines) also show high visitation probabilities. On the contrary, large agricultural areas (e.g. Northern France, the Netherlands, Denmark) present very low values (< 25%).

The habitat provision service of forest is mapped in Figure 11, which shows the extent of forest cover within the boundaries of Natura 2000 sites. The hotspots of habitat protection are found in Eastern Europe, particularly Poland, Slovakia, Romania, Slovenia, Croatia, and Northern Scandinavia. Moreover, particularly Finland, Germany, France, Spain and Italy have comprehensively large but more fragmented protected forests, whereas the British Isles have relatively few and small protected forests.
The ability of forests to store carbon is mapped in Figure 12 as topsoil organic carbon (g C kg-1) in forested areas (data only available for areas with elevation lower than 1000 m). While the data are not available for Norway, Switzerland and part of Eastern Europe, it is evident that the highest concentrations of soil organic carbon (> 100 g C kg-1) is found in North European forests: particularly in Sweden and Finland, but also in the Baltic countries and Scotland. In the northern peatland areas, carbon is stored also in layers lower than the topsoil. German, Austrian and central European forests in general are in the 50-100 g C kg-1, whereas other forests are predominantly in the 25-50 range.
The amount of above-ground carbon stored in forests is mapped in Figure 13. As estimates for this variable were derived from above-ground living forest biomass by application of conversion factors varying little across ecological zones, patterns in the map reflect those visible in Figure 4. Highest values per unit area (> 8000 tons km-2) are found in Germany, Austria, Slovenia, Croatia and the Carpathian Mountains. Southern France, Germany, Poland, Baltic countries and, most of all, Southern Sweden present large areas characterized by medium to high values (6000-8000 tons km-2).
The range of recreational opportunities offered by forests is presented in Figure 14, which shows the Recreational Opportunity Spectrum (ROS) of forested areas. The vast majority of European forests provide a wide range of recreational opportunities within easy reach from urban areas (categories 4 and 7). Forests in Northern Scandinavia and the Carpathians, as well as (to a lower extent) in Spain, Greece and Austria provide exceptional opportunities too, but are hardly accessible because of their remote locations, the ruggedness of the terrain or the presence of poorly extended road networks.

The symbolic value of forests is mapped in Figure 15 as the presence of forests within, and in a radius of 3 km around, natural and mixed UNESCO World Heritage Sites. The most evident sites are the Dolomites in Italy, the Plitvice Lakes National Park in Croatia, the Durmitor National Park in Montenegro, the Caves of Aggtelek Karst and the Beech Forest of the Carpathians in Slovakia, the High Coast/Kvarken Archipelago in Central Sweden and the Lapponian area in Northern Sweden.

3 Institutional mapping
3.1 Methods and data
3.1.1 Mapping through document analysis
Institutional mapping was carried out to identify future societal demand for FES, as formalised and expressed in policy, i.e., policy demand. The policy demand was analysed through detailed policy document analysis, for which a protocol and database were developed during the first 6 months of the InnoForESt project. The aim was to capture context specific and relatively dynamic policies, which reflect national or regional priorities and tackle new emerging issues, such as ecosystem services, innovations or new governance mechanisms.
As a first step, we conducted a quick scan of academic and grey literature on existing comparisons of forest and FES relevant policy documents and forest management systems to organise the development of the database and determine the appropriate data sources (e.g., Hauck et al., 2013; Newig and Fritsch, 2014; Forest Europe, 2015; Harrinkari et al., 2016; Winkel and Sotirov, 2016; Bouwma et al., 2018; EASAC, 2017; Ludvig et al., 2018). In the second step, we obtained conducted a scan of the available types of policy documents that European countries have and the entities responsible for them. We found that almost all European countries have a National Forest Programme (NFP) or in the case of countries with federal structures, such as Italy and Germany, a similar policy process on the federal level. In the InnoForESt case study countries (Austria, Czech Republic, Finland, Germany, Italy, Slovakia and Sweden), the programmes are generally entitled forest policies or strategies and endorsed by national ministries or federal governments (Forest Europe 2015).
The documents analysed were chosen based on their availability and relevance for forest management and forest ecosystem services. Forest strategies were anticipated to reflect policy demand for forest ecosystem services and governance and business innovations in a a context-specific and dynamic fashion because they address policy in the medium term (often 10 years). Generating demand for other uses of forests than timber production, we chose to analyse biodiversity strategies and bioeconomy strategies. We also considered rural strategies or strategies highlighting green infrastructure and recreation but the different countries and regions did not appear to have a uniform set of such strategies. All case study partners were requested to analyse at least the three following documents:
- National or regional forest strategy
- National or regional biodiversity strategy
- National or regional bioeconomy strategy
The initial mapping was conducted in 2018 through a document analysis, covering European strategies and national or regional strategies and/or legislative documents from all InnoForESt case study countries or regions. Each analyst started with the national or regional forest strategy. Additionally, and in case of the region not having one of the above-mentioned documents, the partners could analyse different documents such as laws. This was recommended if they found them more relevant than strategies for guiding practices in their regions. In Germany and Italy for instance, the most relevant strategies guiding decision-making in forest ecosystem services were regional, and were thus chosen for the analysis (Table 8).
| Country or Region | Document |
|---|---|
| Europe | EU Forest Strategy |
| Europe | EU Biodiversity Strategy |
| Europe | EU Bioeconomy Strategy |
| Austria | Biodiversitäts-Strategie 2020+ |
| Austria | Bioökonomie-FTI-Strategie für Österreich (Bioeconomy-Research-Technology and Innovation-Strategy for Austria) |
| Finland | National Forest Strategy |
| Finland | Biodiversity Strategy |
| Finland | Bioeconomy Strategy |
| Germany | National Strategy on Biological Diversity |
| Germany | National Policy Strategy Bioeconomy |
| Germany | Law for the Conservation of the Forest and for the Promotion of Forestry (Federal Forest Act) |
| Germany – Mecklenburg Vorpommern |
State Forest Law |
| Germany – State of Baden-Württemberg |
State Forest Law Baden-Württemberg |
| Germany – State of Baden-Württemberg |
State Nature Conservation Strategy |
| Italy | Framework Programme on Forests (Programma Quadro per le Foreste) |
| Italy | Biodiversity Strategy |
| Italy | BIT – Bioeconomy in Italy |
| Slovakia | National Forest Programme of the Slovak Republic |
| Slovakia | Updated National Biodiversity Conservation Strategy by the year 2020 |
| Sweden | Swedish Research and Innovation Strategy for a Bio-based Economy |
| Sweden | Strategy for Sweden’s national forest program |
The documents were read and data, i.e. quotes and/or the interpretations of the analyst were entered into a database using an online questionnaire platform (Webropol). The questionnaire was developed in an iterative process allowing several rounds of commenting by the project participants in a face-to-face meeting, over Skype, and via email, to increase inter-coder reliability. The iteration aimed at providing a common ground for the final questionnaire users and addressing potential uncertainties regarding how innovations, actors, governance systems and forest management systems could be categorized. The goal was to develop a database allowing a standardized comparative analysis across the case study countries. The database sought to allow the analysis of innovations and supportive conditions for innovations in the forest sector, while accounting for the diversity of possible information sources and overcoming language barriers. In addition, the partners’ earlier expertise and knowledge collected through a brief pre-survey was used as a background for the framing. At later iteration stages, the format of each question was discussed and agreed upon. The final result was a mixture of a few open-ended questions and mainly pre-defined categories allowing for additions through open questions.
The team members who filled in the questionnaire were instructed to use the document analysed as their starting point and to only include observations from the documents, refraining from any personal knowledge or opinions.
A rather comprehensive manual (Annex 2) was developed to aid and standardize the document analysis and filling in the database questionnaire. The aim of the comprehensive manual was to provide explanations to all questionnaire content and the formulation of the questions, clarifying core terms, such as “innovation” and “rights”. The manual also contained instructions on the order and ways to fill out the questionnaire and provided general advice and tips on using the survey tool. We anticipated that not all documents would explicitly address many of the FES, innovations or other factors inquired in the questionnaire and thus the manual included examples of operationalisations and implicit mentions of the FES and other factors.
In addition to the manual document, we organized online skype training sessions for the people who would fill in the questionnaire. These were used to train and to calibrate the document analysis together as a group. Altogether three 2.5-hour sessions with similar content were organised. The sessions included the introduction to the structure of the questionnaire, anticipating technical issues while filling in the questionnaire and a collaborative analysis of three different FES from the EU forest strategy. The collaborative analysis of the EU Strategy FES helped calibrate answers and resolve uncertainties of interpretations that had arisen. The results of the collaborative analyses were included in the instruction materials together with the manual.
3.1.2 Experiences on the analysis process
Support filling in the database questionnaire was provided by the WP2 team throughout the process and the questionnaire had spaces for expressing uncertainties and doubts. On average, it took 2 to 3 days for a person to analyse one document. The time needed was influenced by the length of the document, the language and the analyser’s previous familiarity with it. We asked people to share their experiences on the analysis process via email.
For some it had been more challenging to analyse documents that had scarce mentions of the forest ecosystem services inquired while on the other hand some found it more challenging when there were multiple mentions of the FES and other factors and it was not clear how they were linked. Evaluating the weight or importance of the factors was difficult since the documents varied on the ways they expressed importance or presented central factors. Making interpretations that would not be influenced by the analysts’ previous knowledge or personal perceptions was an acknowledged challenge.
3.2 The factors included in the analysis
3.2.1 Forest ecosystem services
Forest ecosystem services showcase the ecosystem service classifications, as forests are used for producing wood for raw material and energy as well as other goods, while also using them for regulating carbon, nutrient and water cycles as well as for recreating and maintaining a cultural identity (Maes et al., 2012; Saarikoski et al., 2015). Forest policies have addressed multiple forest ecosystem functions and sustainability for several decades (Rammel and van den Bergh, 2003) but the concept of ecosystem services has entered the policy arena more recently (Bouwma et al., 2018).
Operationalising forest ecosystem services for the analysis
The ecosystem services analysed were chosen to match the biophysical FES mapping, yet in a way that was realistic to be identified in the policy documents. Additions to the original ecosystem services list were made after confirming which ecosystem services were meaningful for the case study innovations and after initial quick readings of the EU strategies that would be analysed for the database. Of the additions, recreation was central for the case studies while climate regulation and resilience were central in some of the strategy documents. The forest ecosystem services analysed in the documents included the following:
- Wood
- Bioenergy
- Edible plants and other non-wood forest products: berries, mushroom, cork, other
- Game
- Biodiversity conservation
- Erosion and water protection
- Climate regulation, carbon sequestration and stock
- Recreation: cultural, physical and experiential interactions
- Cultural heritage
- Resilience (risk control and climate change adaptation)
We also asked how the forest ecosystem service was addressed in the document (for example – if it was directly mentioned or only indirectly) and an estimate for the importance given to the ecosystem service in the document (for instance in question 13 – see appendix – where we ask for qualitative weighting expressed as an ordinal scale (0-4)) as well as which other ecosystem services are related to the ecosystem service.
3.2.2 Innovations
With innovation, our analysis sought for new ideas related to forest ecosystem services, building on conceptualisations of technological innovation and innovation systems. Innovation is the development and implementation of new ideas by people who engage in transactions with others within an institutional setting (Van de Ven, 1986). Laying the basis for our understanding of technological innovation, Schumpeter (1911) defines innovation as a continuously occurring implementation of new combinations of means of production. Nelson and Winter (1977), in their institutional analysis, define technological innovation as a non-trivial change in products and processes where there are no previous experiences.
Regarding forest ecosystem services, some of the contextual factors are given and very slow to change; for example, land-use, land-ownership or industry structure evolve only gradually. Therefore, it is important to be sensitive to changes within these structures: emerging or suggested new ecosystem management practices, land-owner collaboration or new business ideas departing from pre-existing operational patterns (Kubeczko et al., 2006). Innovation functions often identified in the analyses of product and process innovations include at least generation or visioning, development and promotion, experimentation and implementation, as well as system-level transition or upscaling (Gopalakrishnan and Damanpour, 1997; Geels and Schot, 2007).
Constructing visions and debating promises is common in innovation processes, where specific characteristics have not stabilized (Brown, 2003; Konrad, 2006). The hype around an innovation, can be also labelled its promotion (Konrad, 2012), promotion through processes of planning, developing or investing in more extensive R&D, testing and piloting (Kivimaa, 2007; Sengers et al., 2016). Such an innovation stage is likely to be followed by attempts to scale up the innovation, for example, to extend market reach (Schreuer et al., 2010).
Innovation processes are often categorized by the types of innovations they produce, for example to design, user, product service and governance innovations (Carrillo-Hermosilla et al., 2010). Product innovations emerge as a result of targeted design processes or as a response to newly emerging demands or, most commonly, as a result of these two (Nelson and Winter, 1977). Product innovations tend to be linked to process innovations but a process innovation might emerge to increase efficiency (Barras, 1990). When innovation results in the introduction of radically or fundamentally different goods or products, it is initially cost-intensive, which calls for process innovations to reduce cost intensity of those goods and products. For forest ecosystem services, new products could include new medical or cosmetic products or fuels, while process innovation could refer to less invasive harvesting technologies or processing technologies producing less waste. Innovations can occur also in the forms of cooperation among actors relying on forest products and services. This may include new client and stakeholder engagement processes, forums, working groups or platforms (Han et al., 2013; Kleinschmit et al., 2014). With strong client orientation, the forest sector has also a fast developing service market on forestry, bioeconomy and nature management (Wolf and Primmer, 2009; Mattila et al., 2013; Kleinschmit et al., 2014). Service innovation exceeds the use of technology (e.g., Gallouj & Weinstein, 1997; Morrar 2014). In terms of forest ecosystem services, we assume that innovation in services does not only result in products or goods, but also in broader, non-technological outcomes, such as policies or governance mechanisms (cf. Morrar, 2014). Market rearrangements and institutional innovation includes transformations in public and economic institutions, but may also refer to cultural institutions (Davis and North, 1970; Hargrave and Van de Ven, 2006; Weatherley and Lipsky, 1977). Although market rearrangement would require changes in formal rules, the new innovations in FES markets might emerge more informally. Besides changes in market relations with respect to the management of forest ecosystem services, this item may include both perceived changes in traditional practices of forest managers as well as prescribed behavioural changes for public servants in the governmental forestry sector (Primmer, 2011).
Operationalisation of innovations for document analysis
For the analysis of innovation in policy documents, we sought a simple structure, anticipating that the policy documents would have little detail on innovations. (Policy innovations could be recorded under governance mechanisms, see p. 30). We distinguished between the stage of the innovation and the type of innovation. For innovations related to each forest ecosystem service, we recorded from the documents the innovation type and stage, as follows.
Innovation type
- Product innovation
- Process innovation and technology improvements
- Social process and networking Innovation
- Service innovation
- Market rearrangement and institutional innovation
Innovation stage
- No mention
- Visioning (promises)
- Promoting (planning, developing, investing in R&D)
- Implementation (piloting, allocating responsibilities, resources, to activities)
- Upscaling (significantly adding resources and responsibilities, e.g., to a new area)
3.2.3 Actors
Forest policies and other policies addressing FES are designed in processes that build on administrative and scientific expertise, and also engage stakeholders in these formal processes. Participatory governance of forests, other natural resources and nature has long been recognized to widen and improve the knowledge-base, onto which policy is designed and to increase the legitimacy of policy through deliberation (Hajer et al., 2003; Primmer and Kyllönen, 2006; Paavola et al., 2009). Stakeholders taking an active role in designing policy are also assumed to improve commitment and effectiveness of policy and its implementation – but sometimes this involvement results in compromises that dilute policies (Newig and Fritsch, 2009). Actors indeed participate in policy design to represent their own interests (Harrinkari et al., 2016). Designing and implementing FES related policies involves many different actors with often quite heterogeneous interests. Thus, policies will evidently need to address variances in the cultural perceptions, values, and socio-economic interests of various stakeholders groups (Hauck et al., 2013; Primmer et al., 2018).
Further, the so-called participatory turn has not reached all governance levels and the ownership of policy design and implementation might remain with the authorities (Maier et al., 2016). Some scholars argue that participatory approaches often fail in reflecting issues of elite capture or politics and by not challenging existing power relationships (Bardhan, 2002; Hickey and Mohan, 2005; Platteau, 2004). Indeed, power is often unequally distributed on a horizontal level, i.e., some policy fields or stakeholder groups have more influence than others. The forest sector has increasingly recognized the need to engage with society also in other processes than formal policy processes (Cashore, 2002). Companies engage their stakeholders. The increasing acknowledgement of stakeholders has followed the demands to improve sustainability, both in the global markets and in local operational contexts (Kourula, 2010; Toppinen and Korhonen-Kurki, 2013; Kleinschmit et al., 2014).
Because ecosystem services broaden the view of forest functions and the benefits that can be derived from forests, they introduce a broader view to stakeholders and actors relevant for policy (Saarikoski et al., 2015). Actors influencing the use and depending on ecosystem services represent different sectors and different types of actors, which requires cross-sectoral and multi-level collaboration (Primmer and Furman, 2012; Loft et al., 2015).
Actors benefiting from ecosystem services can also be assumed to hold rights to use or access, or they can seek to gain such rights (Hein et al., 2006; Primmer and Rinne, 2015). Rights are often not directly stated, rather they can be inferred by references to responsibility, ownership or role, to access, use, manage or make decisions about the ecosystem service (Schlager and Ostrom, 1992). Rights to ecosystem services can be explicitly defined, for example, in laws or ordinances, or they can rely on customs, routines, professional norms, or other informal institutions. For this reason, numerous actors can potentially hold or expect to improve their rights to forest ecosystem services.
Operationalisation of actors for document analysis
Policy documents often identify implementation responsibilities, or at least they report the entity that has been responsible for compiling the strategy or other policy document. Much less directly, the documents reflect rights that actor types might be assumed to hold, that the policy aims to strengthen or secure. We sought to identify also mentions of rights.
The section about actors included two questions with the same structure:
19. Actors and their responsibilities in relation to this FES (actor types in detail)
20. Actors and their rights in relation to this FES (actor types generally)
- Public administration
- Forest and wood using business and industry
- Forest related service business
- Associations, NGOS and CS actors
- Landowners
- Recreational users
- Citizens
- Educational bodies
- Research institutes
- Financiers
3.2.4 Governance mechanisms
The term “governance” captures both, government-driven hierarchical steering based on regulation and broader, more openly engaging policy design and implementation (Wurzel et al., 2013). Thereby, governance depicts a dynamic interaction of actors and institutions (Borrás and Edler, 2012). While policy is seen as operating with a range of instruments resting on differing logics (Howlett, 1991), governance further emphasizes voluntary instruments and cooperative structures. Cooperation is understood to support hierarchical structures opening up, through so-called multi-level governance, cross- sector cooperation through both formal and informal networks, and finally engagement of the private sector, businesses and civil society. Most often governance implies certain degrees and forms of self-regulation and cooperation among different types of actors and coalitions (Rhodes, 1997; Biermann, 2007). Thereby, environmental governance depends on various formal and informal institutional structures that determine and regulate resource use at different levels and scales of socio-political organization (Berkes, 2002). In dynamic terms, environmental governance may furthermore imply formal and informal institutional development and change dependent on the social-economic-ecological context (cf. Loft et al., 2015; Vatn, 2005).
The expectations for forest ecosystem service innovations are connected to the different governance-mechanisms and assumptions underlying them (Primmer and Furman, 2012; Primmer et al., 2015). These include hierarchical governance, which can be operationalized through regulation, incentives or information. Ecosystem services are often regulated through natural resource and biodiversity regulation but the emergence of the concept in policies suggests regulation might also be evaluated against the concept (Borgström and Kistenkas, 2014; Bouwma et al., 2018). Securing ecosystem service provision with laws has been suggested to guide green infrastructure and land-use-planning, or as a part of environmental impact assessment and no-net-loss compensation policies (Ruhl et al., 2013; Geneletti 2011; 2015). It is common to expect that learning about the importance of a new societally valued phenomenon would lead to new regulation.
Incentives have been at the centre of ecosystem services policy analysis for long, both as government payments, and as more market-based arrangements (Vatn, 2010; Primmer et al., 2013; Börner et al., 2017). Payments build on ideas of values driving the institutional arrangements and markets forming around recognized non-market benefits, such as biodiversity conservation or water or carbon retention (Wunder Wertz-Kanounnikoff, 2009; Bishop and Pagiola, 2012). Government investments or subsidies can also be allocated using competitive, market-like mechanisms.
Land-use planning is another governance mechanism strongly promoted by the ecosystem services research community (Potschin and Haines-Young, 2011). The excitement about this idea is connected to new spatial data-driven capacities and modelling but practical applications face both technical and institutional challenges (Primmer and Furman, 2012; Ruhl, 2016).
To complement payments and planning, collaborative-adaptive governance mechanisms are often suggested by analysts and by practitioners (Paavola and Hubacek, 2013). The institutional challenges that have been identified in applying participation alongside scientific-technical planning include political agendas, professional norms and competencies, and lack of integration (Primmer and Furman 2012; Saarikoski et al., 2018).
Governance can change radically as a response to societal demand or for reasons that are more political. Indeed, the introduction or dismantling of a policy can be disruptive (Kivimaa and Kern, 2016). These kinds of disruptions are important to recognise when studying innovations. Forest ecosystem service governance might face disruptions, for example, when the policy shifts toward emphasising climate change or bioeconomy.
Operationalisation of governance for document analysis
We operationalised the governance approaches:
- Markets (direct private-to-private, private-to-private with intermediaries, market-like arrangements organized by government
- Incentives by government
- Disruption
- Regulation ((other) laws, statutes)
- Collaborative (networks, cooperatives)
- Information (guidelines, information technology and platforms, extension and advice
- Clearly new governance mechanisms related to this FES mentioned in the document.
3.3 Initial results from institutional mapping
The initial document analysis covering 21 European policy documents resulted in an analysis of 205 ecosystem services; the total would be 210 (10 FES/document * 21 documents), but since some strategies were not completed by the time the database was extracted the total is 205 at the time of writing this deliverable. The 205 FES analysed allow some initial observations on how ecosystem services are addressed in European, national and regional policy.
3.3.1 Forest ecosystem services
The concept of ecosystem services was mentioned either directly or indirectly via nature’s or forest’s benefits to humans in all of the 21 documents that were analysed. Out of the FES, wood, bioenergy, biodiversity and climate regulation and carbon sequestration were identified as central goals in 21 the strategies (Table 9). Some FES were addressed indirectly in several strategies, but many strategies did not address non-wood forest products (game or edible plants), recreation or cultural heritage at all.
| Wood | Bioenergy | Edible plants | Game | Biodiversity | Protection | Climate & carbon | Recreation | Heritage | Resilience | |
|---|---|---|---|---|---|---|---|---|---|---|
| Not mentioned | 2 | 7 | 8 | 9 | 0 | 4 | 2 | 8 | 7 | 7 |
| Mentioned indirectly | 2 | 0 | 1 | 1 | 2 | 5 | 1 | 0 | 3 | 3 |
| Mentioned directly | 3 | 2 | 10 | 5 | 2 | 3 | 5 | 3 | 5 | 4 |
| Stated as an objective | 6 | 3 | 0 | 3 | 6 | 6 | 7 | 7 | 3 | 5 |
| A central objective | 8 | 8 | 2 | 0 | 9 | 2 | 5 | 3 | 1 | 2 |
| Total | 21 | 20 | 21 | 18 | 19 | 20 | 20 | 21 | 19 | 21 |
Forest, biodiversity and bioeconomy strategies differed in how they addressed FES. As was to be expected, the eight forest strategies and laws were the documents that had the clearest mentions of different forest ecosystem services. Wood or timber was mentioned in its traditional uses and also as potential for new uses of wood in e.g. construction, chemicals, and fibres, for example:
”From a life cycle perspective, there are climate benefits of using more wood in construction, as industrial construction wood means shorter construction time, lower emissions and less disturbance in the sustainable society.”
(Strategy for Sweden’s national forest program)
Sustainable use of forests and wood was mentioned several times. Woody biomass was often mentioned as an important renewable energy source, and the strategies identified the potential of forests to meet the growing demand for energy. Direct mentions of the recreational use and nature tourism in forests were also apparent in many documents. To support sustainable use of forests, there were suggestions to develop conservation areas and improve the development and maintenance of recreation infrastructure. Resilience and climate regulation especially to mitigate climate change and maintain forests as important carbon sinks were mentioned in most of the forest strategies. Forests were framed as both affected by climate change but they were also considered to offer solutions, for example:
“Forests are vulnerable to climate change. It is therefore important to maintain and enhance their resilience and adaptive capacity, including through fire prevention and other adaptive solutions (e.g. appropriate species, plant varieties, etc.).”
(EU Forest Strategy)
Game and non-wood products were often either not mentioned at all or mentioned vaguely in a list or indirectly as a by-products or amenities. Berry picking and hunting were small scale local activities often connected to recreation. The documents from Sweden and Finland had slightly more explicit mentions of these FES, but still not clear objectives or targets related to them.
“The total value of traditional natural products – berries, mushrooms and game – also amounts to hundreds of millions of euros annually. They are an important by-product of the forests, both economically and socially.”
(National Forest Strategy 2025, Finland)
Biodiversity Strategies
In the seven biodiversity or nature conservation strategies, biodiversity conservation was the most central FES, since halting biodiversity loss and fostering biodiversity were the main targets of the strategies as a whole.
Climate regulation and carbon sequestration was also stated as a central objective or objective in four of the biodiversity strategies and was generally related to the idea that protecting biodiversity and forests would lead to improved carbon sequestration and help combat climate change.
“Forests represent major reservoirs of carbon and play a vital role in global climate regulation by contributing to the health of our country and reducing greenhouse gas emissions”
(Biodiversity Strategy, Italy)
“Agriculture and forestry are [therefore] of particular importance and responsibility for biodiversity conservation.”
(National Strategy on Biological Diversity, Germany)
Bioeconomy Strategies
In the six bioeconomy strategies, wood and bioenergy were the FES framed as main objectives. Similar to the forest strategies, wood was the most explicitly measured of the ecosystem services and its targets and economic impacts in society in the form of jobs and profits were expressed clearly. Also the innovation potential for wood and bioenergy sources was brought up occasionally.
“The forest-based industries are a very important EU economic sector (woodworking industries, pulp and paper, printing industries), with a production value of € 365 billion, and an added value of around € 120 billion created by more than 3 million jobs.”
(EU Bioeconomy Strategy)
“Solid biomass fuels (among these wood) represent the main renewable source of energy on a national scale”
(BIT – Bioeconomy in Italy)
3.3.2 Forest ecosystem services and innovations
Bioeconomy strategies included the most mentions and detail on innovations of the analysed documents. Here we present an overview of the different innovation types from all the documents jointly.
| Wood | Bioenergy | Edible plants | Game | Biodiversity | Protection | Climate & carbon | Recreation | Heritage | Resilience | |
|---|---|---|---|---|---|---|---|---|---|---|
| Mentioned | 15 | 10 | 4 | 3 | 16 | 4 | 11 | 6 | 2 | 9 |
| Not mentioned | 4 | 3 | 9 | 6 | 4 | 11 | 7 | 7 | 11 | 4 |
”–growing demand for raw material for existing and new products (e.g. green chemicals or textile fibre)”
(EU Forest Strategy)
Process and technology innovations were found across different ecosystem services, most apparently associated with wood (11) and bioenergy (9). Also biodiversity conservation (6), climate regulation (6) and resilience (6) were associated process and technology innovations. Innovations related to bioenergy, biodiversity conservation and climate regulation were dominantly at the early visioning or promoting stages, while wood related process innovations were also at the implementation and upscaling stages. Resilience was also associated with promoting and visioning of process innovation. The identified process innovations related to new management or planning practices including networks or planning tools and finding new technologies for conservation of natural resources and anticipation of risks.
To optimise technological processes to save or reuse water
(Bioeconomy strategy, Austria)
Social processes and networking innovations were also related to biodiversity conservation (20), wood (13) and biodiversity conservation (8). Visioning and promoting these innovations were dominantly related to wood and biodiversity conservation. Wood-related social process and networking innovations were also identified at the implementation and upscaling stages. These innovations were described as new forms of cooperation and partnerships between different actors and improving communication and engagement via public participation in e.g. planning of forests and ecosystem services. Platforms and networks to enhance cooperation were the concrete measures of some of these partnerships.
“Regional cooperation, interaction between industrial sectors and new services that support the exploitation of surplus materials will enable efficient use of materials close to where they are produced.”
(Bioeconomy strategy, Finland)
Service innovations also related mostly to wood (11) or biodiversity conservation (7). The service innovations identified included engagement of diverse actors especially in land-use planning processes. Consultancy services and capacity building for interested, or improving research and the availability of information was also seen as a service innovation.
“a database to collect and share data on biomass and biowaste actual and potential availability”
(BIT – Bioeconomy in Italy)
Market rearrangements were similarly mostly related to wood (7) or biodiversity conservation (6). These innovations included different forms of payments for ecosystem services (PES) and the removal of harmful subsidies in the context of biodiversity conservation. These payments could come from either business or tourism and be aimed at forest owners. Changes in public procurement standards, paying more attention to sustainability and regulation in the global wood markets, diversifying markets and integrating ecosystem services and biodiversity elements into business models were also brought up as shifts in the traditional ways of markets.
“Bio-based products and bioenergy can be «bio-based versions» of traditional products or novel products with entirely new and innovative functionalities and potential for new and existing markets. To exploit this, the EU is actively driving further development of clear and unambiguous product standards and sustainability criteria at European and international level. These are central for the functioning of the Single Market and the further development of certification and labels that can promote consumer uptake and green public procurement.”
(EU Bioeconomy Strategy)
3.3.3 Forest ecosystem services and actors
We report here the most frequently mentioned actors that were mentioned (directly or indirectly), to have responsibility for FES, or hold rights to them as well as the types of mentions that were associated with rights (mentions of responsibilities were not recorded in text format).
The open text fields for specifying actors or the forms in which the strategies address their rights did not yield many answers. Nonetheless, the ecosystem services wood, bioenergy, biodiversity conservation and climate regulation were connected most often with certain actors and rights of these actors.
Out of the numerous actor categories expected to possibly be identified as carrying responsibility, the public administration clearly stood out as the main actor specified. In particular wood (11), climate regulation (11) and biodiversity conservation (10) were at the responsibility of public administration, and mostly this responsibility was clearly stated. Indirect mentions of public sector holding responsibility over edible plants, cultural heritage and resilience were also identified. Rights were mentioned more indirectly but they were mostly associated with the same ecosystem services.
As we recorded examples of mentions only for rights and not responsibilities, the identified rights were in many cases indeed related to responsibilities. Examples of public administration rights (and likely also responsibilities), included the right to plan forest management, draft laws, policies, guidelines and regulation and carry out and delegate monitoring, data collection and coordination activities related to the majority of the FES mentioned above. Ensuring sustainability, adaptation to climate change, managing risks and conserving biodiversity for future generations were also mentioned as the rights of administration. Directing funds or organising funding for forest related activities such as biodiversity conservation were mentioned. Coordination with international actors and commitments was also the right of public administration. Administrative actors were the ones with the right to prohibit certain actions of e.g. land owners or recreational users of forests. Ministries and state or regional agencies were the actors specified under this category.
Landowners were associated with responsibilities over several FES, most apparently for biodiversity (11), wood (9) and recreation (7). Also game (6) and resilience (6) were mentioned as landowners’ responsibilities, at least indirectly. The rights of landowners were mentioned clearly for wood, and more indirectly for many other FES. For example right to biodiversity conservation (7) and receiving monetary compensations for conservation, and recreation (5) were identified. Additionally property rights and a right to receive information regarding issues such as sustainable forest management and the status of their forests and protection and information on risks such as flooding were mentioned in the open answers. Landowners were also once perceived as having a function in awareness raising on forests. Hunting was also a landowner right:
Hunting in the cultural landscape is necessary to avoid substantial economic and ecological damages.
(National Strategy on Biological Diversity, Germany)
Limiting access to their lands was a landowner right and could be justified e.g. by game management needs. Participation in negotiating issues related to access and changing the uses of their lands (e.g. from agricultural lands to recreational ones) was also their right. Stability and longer term visions of land-use planning were also considered landowner rights.
Forest and wood using business and industry was mentioned as responsible for wood (7), and indirectly for biodiversity conservation (7), resilience (6) and erosion and water protection (5). Forest related service business was hardly identified with any FES, except for recreation (6).
Trade unions were not associated with FES. Rights of business and industry were identified more indirectly but right to wood was mentioned clearly (6). They were identified as having the right to benefit from research and have a sustainable operating environment and materials, or lobby for their needs. Risk management and avoiding risks such as pests was also seen as the right of industry. Development of new and more ecologically sound technologies and operating and management procedures were also mentioned. For bioenergy specifically, one mention was the industry’s right to benefit from the side streams of wood production. Industry was perceived as a stakeholder with the right to participate in different fora where its operations were governed.
“Agriculture, forestry, fisheries and aquaculture require several essential and limited resources to produce biomass. These include land, sea space, fertile and functioning soils, water and healthy ecosystems, but also resources such as minerals and energy for the production of fertilisers.”
(EU Bioeconomy strategy)
Associations, NGOs and Civil society actors were generally mentioned in a vague manner, their main right being some form of participation in education and awareness raising on environmental issues or involvement in nature conservation. Participation as a stakeholder in the EU was mentioned. The Finnish Strategy on biodiversity explicitly mentioned the participation rights of the Sami people and infrastructure services and non-wood products social and economic values as a right for civil society.
Citizen’s rights included the right to benefit from nature in the forms of recreation, right to a clean environment, right to use nature sustainably. The access to nature should also be socially balanced according to one strategy. These ideas reflect the environment as a public good and essential for human wellbeing also for future generations, which was also explicitly mentioned in some of the documents. One mention indirectly specified art and culture around nature as a source of wellbeing. Citizens and social uses of forests were seen as creating acceptability for the non-use or not implementing forestry in all forests.
“–the nature and nature experiences are an important source of well-being”
(Bioeconomy Strategy, Finland)
Recreational users, tourists, and citizens were sometimes mentioned indirectly as having responsibility in particular for biodiversity, recreation and edible plants. More apparently, recreational users were mentioned indirectly or directly as holding rights to recreation (9), wood (9) and biodiversity conservation (8). Wood was considered, in some way, to be the responsibility of citizens, and frequently, their right (13). Biodiversity conservation (12), recreation (10), cultural heritage (7) and edible plants were also framed as citizen rights.
One right was access to information regarding biodiversity. Jobs, and wellbeing at these jobs, in fields related to the forest environment and new forms of income and employment were also brought up in relation to e.g. the bioenergy sector. Benefitting from new sustainable energy sources was also a right of citizens.
Research was mentioned directly and indirectly as holding responsibility for wood (10), bioenergy (8) and biodiversity conservation (7). Financier responsibility was mentioned directly direct for wood (8) and indirectly for bioenergy, biodiversity conservation, climate regulation and recreation. Educational bodies were in some cases associated with some FES.
3.3.4 Governance and forest ecosystem services
Market mechanisms were directly and indirectly identified to be developed for wood (11) and indirectly or with unclear mention for biodiversity conservation (6) and for some other FES.
Incentives by government were frequently mentioned as being developed for wood (13) and less frequently for biodiversity conservation (8) and bioenergy (7). All other FES were identified with incentives in some documents, at least indirectly.Disruption was not identified in the documents other than a few indirect or direct mentions mostly for wood (4), climate regulation and biodiversity conservation. The mentions included changes in the control and planning of harvests or forest landscapes in general.
Development of regulation was frequently identified in the documents, in particular for wood (12), biodiversity conservation (12), and bioenergy (9). Some mention for regulation development was identified in some document for every FES.
Collaboration as a governance mechanism was mentioned to be developed frequently, in particular related to wood (15), biodiversity conservation (10) and at some indirect mentions for all FES.
Information as a governance mechanism was envisioned to be developed in particular for biodiversity conservation (14), wood (11) and climate regulation (11). Some information ideas were identified for all FES.
4 Discussion
The mapping work done thus far portrays the geographical distribution of biophysical forest ecosystem services and an approach and initial testing of institutional mapping. The idea of combining biophysical mapping and institutional mapping to assess the supply and demand for FES remains to be tested, and will be developed in the next stage of this work. The fact that the policies communicate goals only for very large areas, mostly for countries, or in some cases for regions, will constrain any detailed correlation analysis. Yet, we anticipate that the coincidence of abundance of particular FES with strategic commitment to innovation or new governance mechanism, even new benefit distribution will be the main outcome of the mapping.
Connected with this Deliverable is a database for the use of InnoForESt researchers and Work Packages. So far, the biophysical FES data and the policy document derived data are in different databases, which will be shared in the project through the password protected platform on the website. The biophysical maps will be made available in image format (e.g. .jpg, .pdf) via the InnoForESt website to publicly share the information where, and in what amount, FES are provided across Europe.
The biophysical raw data (i.e. raster datasets) can already be used, for example, for identifying supply hotspots for specific FES, identifying areas that are important for the combined provision of multiple FES, detecting forested regions characterized by a limited supply of FES. While this report presents maps of different FES one by one, it is the combination of multiple maps that can unveil interesting insights in terms of ES trade-offs and synergies at a spatial scale. Thus far, only one map is presented for each ES (with the exception of pollination), whereas having two (or more) maps would provide a more comprehensive information about each FES. For example, in the case of soil stabilization, beside the current map showing where forest is securing steep slopes, we could have a second one showing where steep slopes are under other uses. This “multi-map” approach would disclose some preliminary information about the demand side of ES.
The database on institutional factors can already be used to analyse the coincidence of FES, innovations, actors, and governance approaches in the analysed policies as well as the specific framings for these factors. The two databases will be merged (or at least matched) once the institutional analysis is complete.
Ideally, trends in FES would be well understood for analysing governance and innovations. However, our analysis will not extend to temporal analysis. Our biophysical maps do not consider temporal aspects owing to the amount of data analysis and matching that would be required to assess the past evolution in ES provision and the highly complex modelling that would be needed to estimate future ES provision based on the current situation and expected changes in natural resource management and urbanization trends.
The institutional mapping will be extended to cover more countries and regions. It can also be extended to cover more policy document types. The challenge will be that e.g. rural development and nature tourism strategies do not exist in all countries, and they are very different indifferent contexts, which reduces comparability. Laws vary more temporally than strategies, some of them might be from several decades back. Laws define the operating principles or the foreseeable future, so they are not as dynamic as strategies. Already the strategies we have analysed now for the institutional mapping show a lot of diversity in how they address innovations, actors and governance mechanisms.
Thus far, the policy analysis has focused on what was typical in the documents but the aim is to look into spatial variation. For example, the analysis shows that the actors, whose roles are clearly defined in strategies, are dominantly public administration actors. The institutional mapping identifies also the rare mentions of actors, innovations, disruptions, governance mechanisms, which are relevant for innovation analysis, seeking to recognise weak signals. In general specificity vs. generality will be one analytical focus in the next sets of analyses.
Biophysical maps and information about forest management and innovations coming from the institutional mapping will eventually be combined to understand how the potential supply of FES encourages the adoption of specific management types and/or the introduction of innovation. In the first instance, we will analyse whether the abundance of a FES coincides with strategic goals for it. Also other datasets could be overlaid with the two datasets. For example, an overlay of biophysical maps and maps of population distribution and density may help detect potential mismatches between the demand and supply of FES. The combined analysis of biophysical and institutional data as presented in this report may require information on land ownership, given the different management and governance approaches that are possible in public versus private lands.
By analysing how different EU, national and regional policies address different forest relevant innovations, governance mechanisms and actors, we will be in a position to develop a deeper understanding of the biophysical-institutional landscape that can condition innovation in the forest sector, and ideally, identify opportunities for transferring and upscaling innovations. Activities in the case study areas can be described in detail and “pinned” onto the maps and possibly used as points of evaluation of how the ecological-institutional condition might host innovation. Using the biophysical and institutional mapping, we can identify niche innovations for further co-learning.
References
EASAC_Forests_web_complete.pdf ↑
Research Policy 26:537-556. ↑
Birkhäuser, Basel. ↑
Annexes
Annex 1: Database Questionnaire
INNOFOREST DATABASE

Welcome to the database questionnaire! It will help getting an overview on Forest Ecosystem Services and innovations in this very field across Europe, through document analysis. Please fill in the questionnaire document by document and ecosystem service by ecosystem service.
Please read the before answering, it will provide you with important information on each question of the questionnaire.
The purpose of this institutional mapping is to gain an understanding of the institutional structure of Forest Ecosystems across Europe and in the case study regions. This is to support the more detailed analyses, comparison and upscaling in the project. The questionnaire is part of task 2.2 on InnoForESt.
We thank you for your time and commitment!
P1: BACKGROUND INFORMATION ON THE DOCUMENT
Since the questionnaire is filled in for each FES, even if not mentioned in the document, you will be filling in this questionnaire a total of 10 times/document.
The background information on this page should always be filled in completely when you are filling in the questionnaire for the first time relating to a certain document. The following 9 times you can only answer Q1 “Document name” on this first page and we will automatically fill in the rest of the background information after you have completed the questionnaire for all FES. So you submit after each FES, and start a new survey for the next FES. Be sure to fill in the name in the same format since it is the identifier for us when completing Q2-13!
1. Document name
______________________________
2. Year published
[DROP MENU YEARS 1900-2018]
3. Document type
( ) Strategy
( ) Law
( ) Act
( ) Manual
( ) Programme
( ) Other, what: ________________________________
4. Entity responsible for document
_______________________________________
5. Geopolitical coverage of the document
[DROP MENU]
Regional
National
EU
European
International
6. Country
[DROP MENU EUROPE]
7. Types of forest management systems in the area that the document covers. Please mark the dominatin
Clear-cut, even-aged stands YES NO DOMINATING IDK
Clear-cut with retention trees YES NO DOMINATING IDK
Clear-cut with retention habitats YES NO DOMINATING IDK
Continuous cover forestry / selective YES NO DOMINATING IDK
single-tree removals
Coppice YES NO DOMINATING IDK
Close-to-nature management YES NO DOMINATING IDK
Afforestation (new plantations, e.g. on YES NO DOMINATING IDK
former agricultural land)
Agro-forestry (e.g. wood pastures and YES NO DOMINATING IDK
shelter trees)
Other, what:______________________ YES NO DOMINATING IDK
8. Are there clearly new forest management systems mentioned in the document, and if yes, please describe:
( ) No
( ) Yes, specify
________________________________________________________________
________________________________________________________________
9. Stated purpose of the document
________________________________________________________________
________________________________________________________________
________________________________________________________________
10. Does this document follow or replace a previous document addressing the same topic? If yes, please specify the preceding document and its publishing year.
( ) No
( ) Yes, please specify (name and year): ________________________________
11. Is the phrase “ecosystem service(s)” mentioned directly and/or through benefits and values provided by forests for humans
( ) No
( ) Yes, please specify (quote): _______________________________________________
P2: FOREST ECOSYSTEM SERVICE ANALYSED
Reminder: Each ES as one questionnaire completed ->
submit and then fill next FES
12. Forest ecosystem service type
[DROP MENU]
Wood
Bioenergy
Edible plants and other non-wood forest products: berries, mushroom, cork, other
Game
Biodiversity conservation
Erosion and water protection
Climate regulation, carbon sequestration and stock
Recreation: cultural, physical and experiential interactions
Cultural heritage
Resilience (risk control and climate change adaptation)
13. How is the forest ecosystem service addressed in the document? You may use a quote to specify.
________________________________________________________________
________________________________________________________________
14. Weight or importance given to the ecosystem service in the document
( ) 0= No mention
( ) 1= Mentioned indirectly
( ) 2= Mentioned directly but not an objective
( ) 3= Stated as an objective but no stated targets or measures for implementation
( ) 4=A central objective with clear targets and measures for implementation
If you have answered “0= No mention” to the previous question (Q14) you may skip to the submission page of the questionnaire and submit your answers. No need to fill in the rest of the questionnaire.
15. Other forest ecosystem service class related to the FES being analysed
[TICK BOXES]
Wood
Bioenergy
Edible plants and other non-wood forest products: berries, mushroom, cork, other
Game
Biodiversity conservation
Erosion and water protection
Climate regulation, carbon sequestration and stock
Recreation: cultural, physical and experiential interactions
Cultural heritage
Resilience (risk control and climate change adaptation)
16. Other documents, policies etc. mentioned as relative to the management of this FES
________________________________________________________________
________________________________________________________________
P3: INNOVATIONS
17. Are there innovations related to this forest ecosystem service? If yes, how are the innovations expressed?
( ) No
( ) Yes, please specify: _______________________
18. How would you classify the innovation stage and type?
Key for the scale (also briefly above the numbers in webropol):
0=No mention
1=Visioning (promises)
2=Promoting (planning, developing, investing in R&D)
3=Implementation (piloting, allocating responsibilities, resources, to activities)
4=Upscaling (significantly adding resources and responsibilities, e.g. to a new area)
PLEASE SPECIFY
Product innovation 0 1 2 3 4
Please specify:_________
Process innovation and technology 0 1 2 3 4
Improvements
Please specify: _________
Social process and networking 0 1 2 3 4
Innovation
Please specify: _________
Service innovation 0 1 2 3 4
Please specify: _________
Market rearrangement and 0 1 2 3 4
institutional innovation
Please specify_________
Other, what: _______ 0 1 2 3 4
P4: ACTORS
19. Actors and their responsibilities in relation to this FES
Scale for the role given to the actor in relation to the FES in the document being analysed (also briefly above the numbers in webropol)
0=not mentioned
1=indirectly mentioned
2=clearly mentioned but with no clear responsibilities
3=mentioned and responsibility clear
4=Central responsibilities
Public administration 0 1 2 3 4
European 0 1 2 3 4
EU 0 1 2 3 4
National 0 1 2 3 4
Regional 0 1 2 3 4
Local 0 1 2 3 4
Forest and wood using business 0 1 2 3 4
and industry
Planning 0 1 2 3 4
Harvesting 0 1 2 3 4
Wood and biomass processing 0 1 2 3 4
Forest related service business 0 1 2 3 4
Nature tourism 0 1 2 3 4
Hunting business 0 1 2 3 4
Health business 0 1 2 3 4
Training business 0 1 2 3 4
Associations, NGOS and CS actors 0 1 2 3 4
Environmental 0 1 2 3 4
Unions 0 1 2 3 4
Industrial 0 1 2 3 4
Youth organizations 0 1 2 3 4
Landowners 0 1 2 3 4
Private 0 1 2 3 4
Public 0 1 2 3 4
Foundations 0 1 2 3 4
Collective 0 1 2 3 4
Recreational users 0 1 2 3 4
Tourists 0 1 2 3 4
Hunters 0 1 2 3 4
Sports clubs 0 1 2 3 4
Everyman (open access users) 0 1 2 3 4
Citizens 0 1 2 3 4
Inhabitants 0 1 2 3 4
Employees 0 1 2 3 4
Educational bodies 0 1 2 3 4
Schools (day-care to upper secondary) 0 1 2 3 4
Vocational schools 0 1 2 3 4
Applied Universities 0 1 2 3 4
Universities 0 1 2 3 4
Research institutes 0 1 2 3 4
Forest 0 1 2 3 4
Agriculture 0 1 2 3 4
Environment 0 1 2 3 4
Water
Climate 0 1 2 3 4
Technology 0 1 2 3 4
Financiers 0 1 2 3 4
Public 0 1 2 3 4
Private 0 1 2 3 4
PPP
Other, specify:_______________ 0 1 2 3 4
Other, specify:_______________ 0 1 2 3 4
Other, specify:_______________ 0 1 2 3 4
Other, specify:_______________ 0 1 2 3 4
20. Actors and their rights in relation to this FES
Scale for the rights given to the actor as beneficiary of the FES in the document being analyzed (also briefly above the numbers in webropol)
0=no reference to rights
1=indirect mentions of rights
2=clear mention of rights but not clear whether they need to be maintained or strengthened
3=clear mention of rights that need to be maintained
4=clear mention of rights that need to strengthened
Public administration 0 1 2 3 4
TXT BOX
Forest and wood using business 0 1 2 3 4
and industry
Forest related service business 0 1 2 3 4
Associations and Civil society actors 0 1 2 3 4
Landowners 0 1 2 3 4
Recreational users 0 1 2 3 4
Citizens 0 1 2 3 4
Educational bodies 0 1 2 3 4
Research institutes 0 1 2 3 4
Financiers 0 1 2 3 4
Other, specify:_______________ 0 1 2 3 4
Other, specify:_______________ 0 1 2 3 4
Other, specify:_______________ 0 1 2 3 4
Other, specify:_______________ 0 1 2 3 4
P5: GOVERNANCE MECHANISMS
21. Governance mechanisms mentioned related to the FES
Scale for governance mechanisms (also briefly above the numbers in webropol) Specify not compulsory.
0= no reference
1=indirect mention
2=clear mention but not clear what development is expected
3= clear mention that will be developed
4=clear mention that will be developed into new and/or innovative mechanism
Markets (direct private-to-private, 0 1 2 3 4
private-to-private with intermediaries,
market-like arrangements organized by
government
SPECIFY:________________________
Incentives by government 0 1 2 3 4
SPECIFY:________________________
Disruption 0 1 2 3 4
Regulation ((other) laws, statutes) 0 1 2 3 4
SPECIFY:________________________
Collaborative (networks, cooperatives) 0 1 2 3 4
SPECIFY:________________________
Information (guidelines, information 0 1 2 3 4
technology and platforms, extension and
advice)
SPECIFY:_________________________
Other, what: _______________________ 0 1 2 3 4
22. Are there clearly new governance mechanisms related to this FES mentioned in the document. If yes, please describe them:
( ) No
( ) Yes, specify
________________________________________________________________
________________________________________________________________
23. Open text box for unsure questions, quotes etc.
________________________________________________________________
________________________________________________________________
________________________________________________________________
________________________________________________________________
Remember to always submit and only then start again for the next FES!
This way we will get the data right in the output sheet.
SUBMIT
If you are going to code a new FES, submit this form and start a new one by clicking freshly the link.
Annex 2: Manual For Database Questionnaire
INSTRUCTIONS FOR FILLING IN THE INNOFOREST T2.2 DATABASE QUESTIONNAIRE
T2.2 Schedule:
- May: Skype training meetings: 2-3 survey testing and calibration workshops
- May 21st, 22nd and 25th
- June-August: Complete database – at least strategies
- Start coding in June, so you can ask for support and rehearse in time
- End-of-August is a fixed deadline.
- September: Initial analysis of database and draft reporting
- October 2018 review and submit D2.1 : Mapping of FES and institutional frameworks – Draft Report
- October 2019 D2.2: Mapping of FES and institutional frameworks – Final report
- May 2020 D2.3 : Inventory of innovation types and governance of innovation factors across European socio-economic conditions and institutions – Report and manuscript for a scientific article
Read the manual BEFORE reading and coding strategies for filling in the database questionnaire. Note! Some words in this document contain links to websites or other documents that provide more information.
In addition to this manual the following documents have been provided to help you fill in the database questionnaire:
- Clean version of the Webropol questionnaire in .docx format
- Example of a .docx with the FES Wood filled in based on the EU Forest Strategy
- Example of a .docx with the FES Bioenergy filled in based on the EU Forest Strategy
- Excel sheet of strategies being analysed / institution
We encourage you to always ask via email or by comments in the questionnaire if you have uncertainties about anything!
Glossary
CICES= The Common International Classification of Ecosystem Services
ES= Ecosystem service
EUFS= European Forest Strategy
FES= Forest Ecosystem service
FNFS= Finnish National Forest Strategy 2025
FMA= Forest Management System
IDK= I don’t know
Q= Question
- General instructions
Before filling in the database questionnaire we ask you to first read through the whole document based on which you will fill the questionnaire. This allows you to get a general overview of what stands out or seems highlighted in the document. Upon this first reading you may want to take some notes about the highlights or copy certain quotes that reflect what you have felt as important in the document. After this first read, it might also be easier to fill in the questionnaire without getting too stuck on evaluating the mentions and weight of importance given to things.
We wish that the first document analysed would be national forest strategy or forest act of your country or region. This will give us also an idea about how much resources one document takes and help us prioritize what other documents should be analysed from each country. Thus far we will most likely ask at least the analysis of Bioeconomy strategies and Biodiversity (Nature conservation) strategies.
SYKE will do the analysis of the EU documents.
We would also ask you to fill in the table (link to excel) stating the document(s) that you have already analysed or a planning to analyse in order to avoid double work.
Take the document you are analysing as a starting point and do not make inferences outside it (other than in Q7 on forest management systems and Q23 in which you can relate what you have read in the document to what you know from other sources.
Fill the questionnaire always based on one document (strategy or law) and one forest ecosystem service (FES) at a time. Thus you will need to fill in the questionnaire several times based on the one document in order to go through all the FES that we have listed (currently 10 options). So you submit after each FES, and start a new survey for the next FES. (No option to copy the background information (Qs1-12) automatically is available in Webropol, but when you fill in the questionnaire for the second and following times, it will be enough that you just answer Q1 “document title” (make sure the title is identical), and we will fill in the rest in the output sheet). Keep in mind that our primary interest is on ecosystem services related to forests, so the categories about the ES that come up in the questions have been chosen accordingly. T2.1 of biophysical mapping and the CICES classification of ES has also been used when deciding on the classes.
One option is to analyse the document with several copies of the survey open at the same and keep one as the master. It is a good idea to start with the most apparent FES that the strategy addresses (e.g. wood, or biodiversity).
NOTE: Fill in the questionnaire also regarding the FES that are NOT mentioned. These data allow seeing what FES are not explicit in the documents, and will be valuable information for us. Thus we ask that you always fill in the questionnaire until Q14, which when answered “not mentioned” will allow you to leave the rest of the questionnaire blank. An automatic “jump” rule has been inserted into the option “not mentioned” that will lead you to the last page of the questionnaire where you can submit your answers. ALWAYS SUBMIT, even if there is “no mention”.
Many of the attempts to fill in the questionnaire will result in largely empty outputs because the documents do not have relevant content, especially when analysing other documents such as Bioeconomy strategies etc. that might not mention forest ecosystem services explicitly at all. This is fine.
If you are unsure about whether things are “hinted at”, you may put quotes and questions at the end of the survey in the Q22 open text box or via email to the InnoForESt team (liisa.varumo@ymparisto.fi; eeva.primmer@ymparisto.fi)
If you have assisting staff conducting the analysis, be prepared to talk through the analysis with them and preferably allow the one person to do all the documents from your country / region. It is mainly the science partner who is responsible for completing the document analysis.
The questionnaire allows you to “save and continue later” between the sets of questions. Copy the link the questionnaire gives you after you have saved for continuing later, and save it (ie. email it to yourself), so you can start where you got left.
After the questions there are also small help- boxes marked with “?” that appear when you hover the mouse over them giving more information and instructions on what is relevant for the question.
If you wish to test filling in the questionnaire, please write “TEST” at the beginning of Q1 document title so that we know to remove the data row afterwards.
The questionnaire is not filled in anonymously to allow follow-up and clarifications when necessary. Only one responder per strategy is required.
- Some practical tips (Liisa’s and Eeva’s experience)
Tip: Might be practical to not fill in the webropol while reading the document, rather fill in the questionnaire on the word document and then just copy+paste into the webropol. This way you can fill in all the ES from one document on one read into for example separate word files and then fill the webropol several times based on all the ES copy+pasting from word. This might be particularly helpful with forest strategies (and forest laws) because they are the ones that have more information to be included in the database.
If you have a printout, you can choose to use coloured pens and:
Highlight with one colour all the FES (or even use a different colour for each ES)
Highlight with one colour all the actors. If you are analysing the electronic document you can mark the ES with margin comments:
Use consistently the same word for the same ES (e.g. “wood” or “biodiversity” (this way you can search also your comments), and same actors.
Always when looking for a response to a specific question we advise also to check with Ctrl+F the key words of the question from the document. E.g. When searching for the FES bioenergy: ctrl+F “bioenergy” and see what comes up. Additional keyword search tips are given below to many of the questions. Note different spellings of words, e.g. “bioenergy” and “bio-energy” and other possible references to the same topic, e.g., “energy”, “biofuel”, “fuel”.
For non-forest strategies (e.g. BD, bioeconomy strategy) search the document with any forest related terms (ctrl+f “fores*” “wood” etc.) and then analyse those bits in relation to the questionnaire.
- Interpret words broadly: novel, new, innovative
There are questions about new or novel forest management systems, innovations and governance mechanisms (Qs 8, 16, 21). The interpretation of what is meant by “new” or “novel” can be as simple as whether the document uses one of these words with reference to the FES, actor, management type, investment etc. Newness can also be indications of upcoming changes, aims or trends or activities that are going to be implemented according to the document.
Interpretations of whether something is new do not need to be made in terms of new compared to something.
The word “new” 194 mentions in the Finnish Forest Strategy
- The word “innovation”
Schumpeter (1911) defines innovation as a continuously occurring implementation of new combinations of means of production. Nelson and Winter (1977), in their institutional analysis, define technological innovation as a non-trivial change in products and processes where there are no previous experiences. Often, innovation denotes successful introductions of novelties. Innovation is the development and implementation of new ideas by people who over engage in transactions with others within an institutional setting (Van de Ven 1986).
- Rights (Q20)
Rights to ecosystem services can be explicitly defined e.g., in law, or they can rely on customs routines professional norms or other informal institutions. This means that rights are often not directly stated, and we need to interpret them from references to actors’ relationships with ecosystem services and their governance. Basically, we are looking for statements that express that actors have a right to benefit from the ecosystem (Rinne and Primmer, 2015), or to access, use, manage and make decisions about them (Schlager and Ostrom, 1992).
QUESTION SPECIFIC INSTRUCTIONS
These instructions will include some examples to help evaluate what options to choose when questions have scales from 0-4 and also some “hint” words and expressions as to interpreting if something is mentioned or not and what weight should be given to the expression.
We suggest starting the filling process with the FES that you find most central to the document analysed.
These instructions contain illustrative examples from the Finnish National Forest Strategy 2025 (FFS) and the EU Forest Strategy (EUFS). Additionally, filled in examples of the EUFS for the FES Wood and Bioenergy have been provided to you as .docx files.
Upon answering the questionnaire stick to the information provided by the document and avoid over-interpreting, even if you feel that you have a strong knowledge about the topic in question. Only in Q7 if you have personal knowledge about the FMSs please share it. When in doubt about relevance of something we encourage to write it down in the open text boxes or email us to think of the uncertainty together.
In all the questions with ratings you will always need to first choose the rating (from 0-4) before you will be able to write in the open text box.
Qs 1-11 Background information on the document
Q1: In the document name remember to also put the years for which it applies if they are stated in the title.
Write the document name identically for each round you fill in the survey (for each FES).
Q8: The question relates to forest management systems (FMS) in the geographical coverage of the document. Thus if you are reading a national strategy, this means FMS in your country, whereas if you are reading a regional strategy, this refers to FMSs in the region.
The forest management system(s) might not be mentioned in the document. Even if you know them through other sources, you should mark them. Also if all of the FMSs are applicable, please (try) to indicate the dominating (1-2) one(s). If you don’t know the FMS in the area, mark “IDK”. (The background knowledge you have, applies to all the documents representing the same country/region.)
Ctrl+f tips: Clearcut, even-aged system, uneven-aged system
Q9: See interpretations of novel in chapter 3 above. This question is especially interested in changes in FMSs.
Ctrl+f tips for novel: new, diversif*, explor*, devel*
Q10: The stated purpose of the document – question is used to link or find justifications as to why this document is relevant in the institutional mapping of forest ecosystem services innovations. It may also reveal whether the document is relevant to forest policy in general. You can include a direct quote but if the purpose is very long (e.g. 10 points), try to summarize. Put quotation marks “like this” around every direct quote and add the page number of the quote.
Q11: This question aims to give an idea of how often the strategies and policies are changed in different European countries. It may give indications of the importance of the sector, stability of policies and reactions to trends, developments and influences.
Note: For the next rounds of filling in the questionnaire based on the same document you may respond only to Q1 and we will fill in then Qs 2-11 in the output excel after you have submitted all your answers.
Qs 12-16. Forest ecosystem service analysed
Q12: Pay attention to forest ecosystem services only. The type (section) of service (i.e. provisioning, regulating and cultural) is derived from the CICES scheme. Hence, game, for example, is presented as a provisioning service because it refers to the maintenance of game populations in the forest rather than recreational hunting (which would be a cultural service). However, if you wish to comment that the document mentions a direct link or categorizes one ES under several types, you may do so in Q15.
Ctrl+f tips (besides the ES itself):
Wood: timber, woody biomass
Note: new textiles, chemicals etc. aren’t considered FES since they have been highly processed and distanced from being forest ecosystem services.
Bioenergy: “wood-based energy”, “biofuel”, “biomass”,
Edible plants and other non-wood products, berries, mushrooms, cork, sap
Game
Biodiversity conservation: (here you may also mark if protecting forests is mentioned)
Erosion and water protection
Climate regulation, carbon sequestration and stock
Recreation: cultural, physical and experiential interactions
Cultural heritage: “Landscape”, “rural”, “lifestyle”
Resilience: risk control and climate change adaptation: “mitigat*”
Note the difference between “climate regulation, carbon sequestration and stock”, and “climate change adaptation”
Q13: Please add quotes (with quotation marks “like this”) about the mention of the FES to support the evaluation you make on the qualitative weight expressed as an ordinal scale (0-4) in the following Q13.
Example on bioenergy from FNFS:
“The production of bioenergy and biochemicals based on forests and wood will grow” (p.46)
“As the target for forest chip use by 2020 has been set 25 TWh, equalling some 13 million solid cubic metres (m3) of forest chips a year” (p. 14)
“Production of domestic wood-based energy increases” (p.19)
Q14: This question is related to how important or central you analyse the FES to be in the document. Weight is not limited to economic weight or importance of the FES.
Weight given to FES examples and hint words/expressions:
Examples for the rating. Take the “strongest mention” as the ending point.
1= Mentioned indirectly
Example FNFS for erosion and water protection:
Climate change may also influence the erosion vulnerability of soil, and thus the pollutant load from forestry.(p.27)
Example biodiversity conservation EUFS:
Protect forests and biodiversity from the significant effects of storms and fires, increasingly scarce water resources, and pests. These threats do not respect national borders and are exacerbated by climate change.
2= Mentioned directly but not an objective
Example FNFS for edible plants:
The total value of traditional natural products – berries, mushrooms and game – also amounts to hundreds of millions of euros annually. They are an important by-product of the forests, both economically and socially. (p.15)
3= Stated as an objective but no stated targets or measures for implementation
Example from FNFS for bioenergy:
“Production of domestic wood-based energy increases” (p.19)
4=A central objective with clear targets and measures for implementation
Example from FNFS for Biodiversity conservation:
“Both conservation areas and nature management in commercial forests are needed to safeguard biodiversity in the forest environment. These measures also include restoration in compliance with the biodiversity strategy. Restoration of mires that are unsuitable for forestry should be a particular focus area. The management of commercial forests plays a key role in fostering biodiversity, as some 90% of our forests are available for forestry use.” (p.27)
This may also include promoting investments, tai ctrl+F “Promote” (use, raw material), “stimulate”
Q15: Other related FES: mark those that are somehow clearly connected with this FES (not indirect mentions).
Q16: Here you may mention documents that are mentioned in the document you are analysing. Thus if e.g. Action Plans for the implementation of the strategy under analysis are mentioned, please not them and other relevant document here.
Qs 17-18 Innovativeness
See above chapter 4 definition of innovation. Also keep in mind Qs 21 & 22 about governance mechanisms when answering this question. Some of the innovations may apply to new governance mechanisms as well and you may want to note this in Qs 21 & 22.
Q17: In this question you may put a quote or in your own words justify why the FES is innovative. For the next question Q18 you may insert specific quotes or your own words to express certain types of innovations.
Q18: Types of innovation and their stages 0-4
Example of Product Innovation: e.g. new woody biomass-based packaging materials (with FES wood)
Example of Process Innovation and technology improvements e.g. new bioenergy energy processing technologies (FES bioenergy), new internet platforms for ecotourism (FES recreation)
Wood: “prioritise investments in: modernising forestry technologies;” (weight: 3)
Example of Social process and networking innovation, e.g., new forums, working groups, platforms for engaging actors (any FES)
Example of Service Innovation: e.g. new data management systems, new training or extension services (any FES, e.g. bioenergy, biodiversity)
Example of Market rearrangement and institutional innovation: e.g. development of a payment, offsetting or banking mechanism (any FES, e.g., climate regulation)
Qs 19 and 20 Actors
There are two questions in the actors section – one related to RESPONSIBILITIES and the other to RIGHTS
In these questions all alternatives (rows) should have a tick, since we also want to see the “not mentioned” actors.
They are not selected as default because we want you to read through each of them and tick the role of the actor.
Each option in bold is a higher category and what comes below are subcategory options from which to choose and for which to mark a role. You may also tick a role for the higher category, if none of the subcategories appear in the document. At the end of the list there are currently 4 slots to specify actors that don’t fit in the given categories.
An empty space for specification will be left after each actor for additional comments or remarks.
Q19: Examples of responsibilities scale:
How to deal with actors that have a role in preparing the document? Not necessarily role in any specific FES.
1=indirectly mentioned
2=clearly mentioned but with no clear role
3=mentioned and role clear
Example in climate regulation for several actors (FNFS 36) listed in a box as “other actors”:
Finnish Forest Centre, Finnish Forest Association, Natural Resources Institute Finland, universities, Finnish National Board of Education, nature and environment schools, NGOs, actors in the sector
4=A central responsibility role
Example for recreation and role of Associations and civil society actors:
NGOs play a key part in achieving the targets related to the recreational and well-being use of forests and developing citizens’ relationship with the forests. (FNFS p. 29)
Q20: Actor’s rights.
Here the lower categories have been replaced by open text boxes where you may specify the actor. You can list several actors in the same box, separate them with a semicolon or you may also use the “Other, what” box at the end.
Consider all types of rights; access, property, use and management rights. Also see section 5 “Rights”.
Examples of rights scale:
1=indirect mentions of rights
Example regulating FES for land-owners:
“…creating new woodland and agro-forestry systems” (EUFS)
2=clear mention of rights but not clear whether they need to be maintained or strengthened
Example recreation FES for citizens and tourists:
“…societal benefits, including for human health, recreation and tourism” (EUFS)
“The accessibility of forests also plays a key role in building and keeping up a relationship with the forest; in this respect, local forests used by day-care centres and schools are of vital importance.” (FNFS p. 29)
3=clear mention of rights that need to be maintained
Example climate regulation for industry:
“Respond to the challenges and opportunities that forest-based industries face in…, climate policy“ (EUFS)
4=clear mention of rights that need to strengthened
Example wood for industry:
“Stimulate market growth and internationalization of EU Forest-based Industry products” (EUFS)
Qs 21 and 22 Governance mechanisms
Q21
Q22
Q 23 Open text box
Here you may add any quotes, questions or uncertainties meaningful for T2.2. Also if you feel that something highly important for the mapping is expressed in the document that does not fit into the above questions, you may mention it here.
Table of Contents