Deliverable 4.1: Mixed method matching analysis
– Suggested methods to support the development and matching of prototypes to the different innovation regions –
| Work package | WP4: Innovation platforms for policy and business | |||
|---|---|---|---|---|
| Deliverable nature | Report (R) | |||
| Dissemination level (Confidentiality) | Public (PU) | |||
| Estimated indicated person-months | 10 person months (PM) | |||
| Date of delivery | Contractual | October 31, 2019 | Actual | October 31, 2019 |
| Version | final | |||
| Total number of pages | 91 | |||
| Keywords | Matching framework, innovation process, prototyping, methods to support prototyping, knowledge exchange and co-creation, participation, innovation teams, innovation regions | |||
List of figures
- Figure 1: InnoForESt framework for the mixed methods matching analysis (matching framework).
- Figure 2: Four different interfaces of knowledge exchange and co-creation.
- Figure 3: Up-grading, up-scaling, and replication as three possible strategies for prototyping.
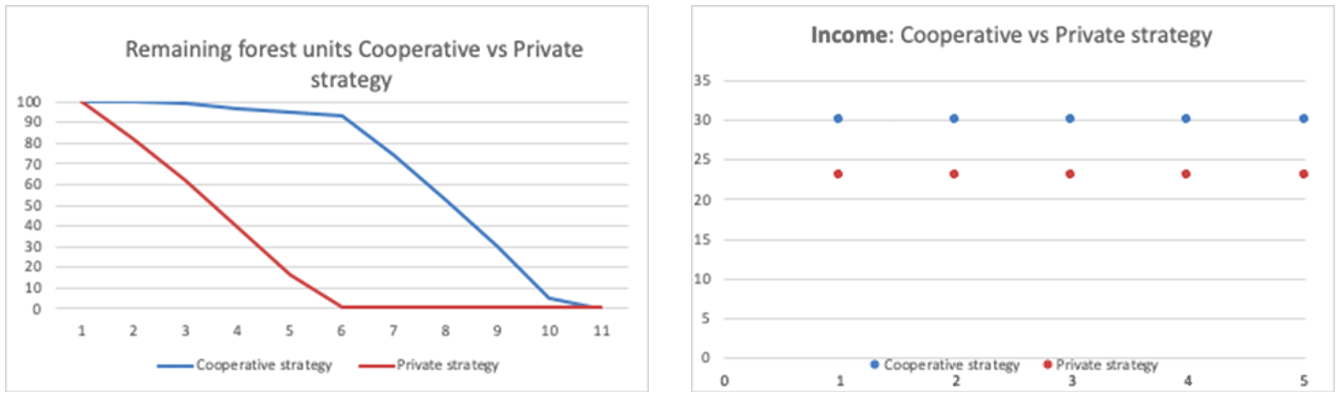
- Figure 4: Differences in private and cooperative strategies. On the left-hand side, you can see different ways of the degradation of the ecosystem services provision (from 100 resource units to 0 at the end of the game). The figure shows that the private strategy leads to earlier degradation, while a cooperative strategy leads to prolonged sustainable provision. In the right-hand side you can also see that the cooperative strategy also yields higher financial benefits.
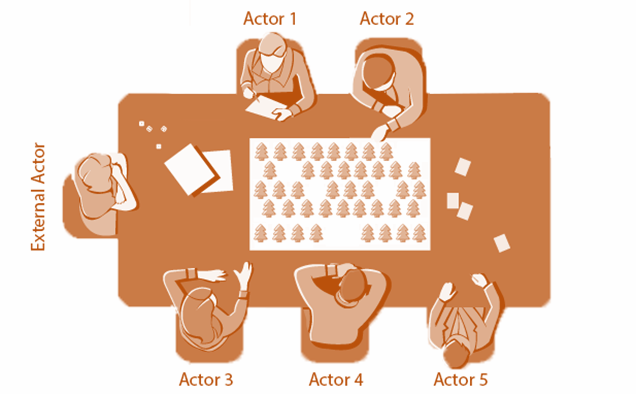
- Figure 5: Actor composition for each RBG session, with flexibility in assigning actors roles, including one actor representing an ‘external’ actor with regulatory, sanctioning, and monitoring power.
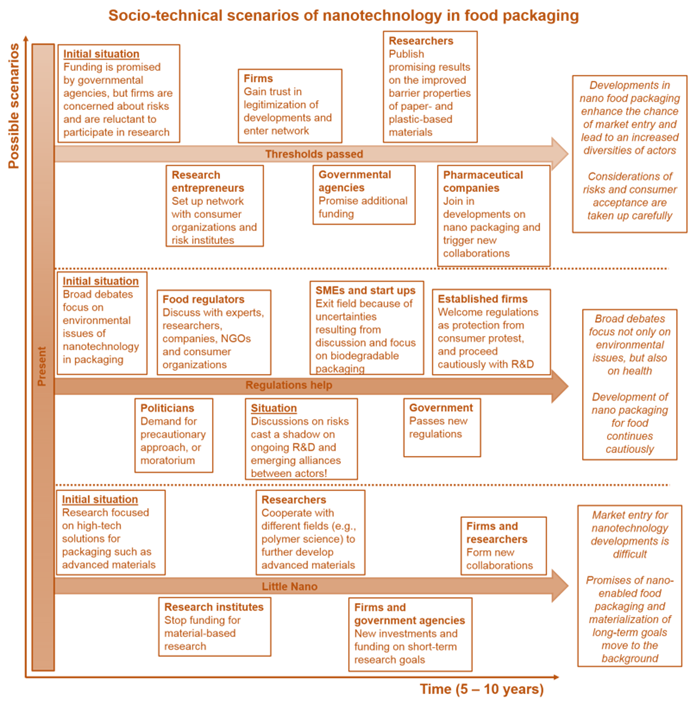
- Figure 6: CINA example 1: Research directions for a young interferometer biosensor.
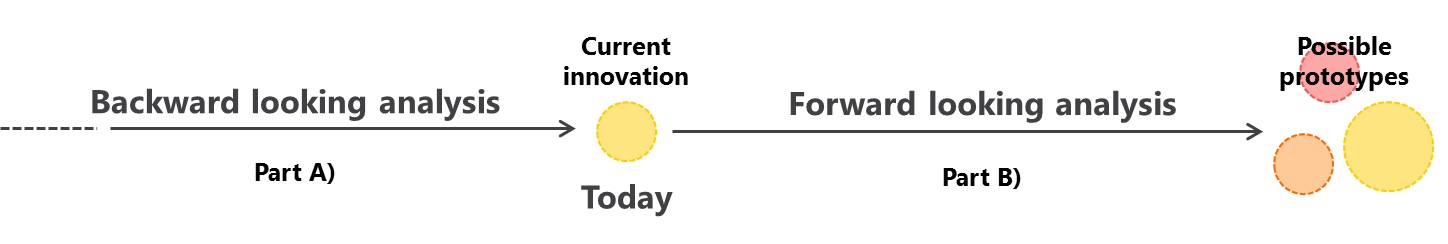
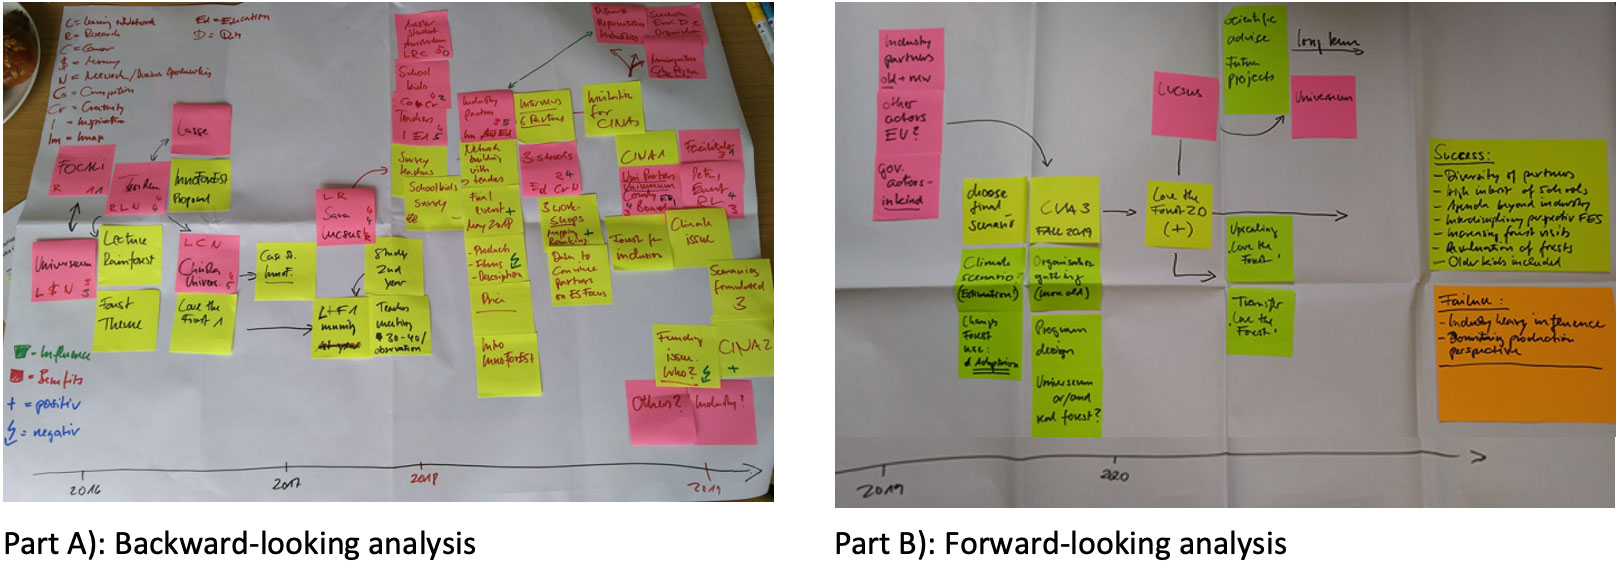
- Figure 7: Backward- (part A) and forward-looking (part B) analysis of the Process Net-Maps.
- Figure 8: Example of two Process-Net-Maps from the Swedish innovation region.
- Figure 9: Template of the feedback sheet.
- Figure 10: Map and typology of relevant stakeholders in the innovation region Austria, related to the innovation idea ‘mobile wooden houses and tourism’.
- Figure 11: The six videos produced for the InnoForESt innovation regions are all available on the InnoForESt project website.
- Figure 12: Conducting the role board game in the Finnish innovation region.
- Figure 13: Photo impressions from conducting an ‘on-the-job’ interview right in the forest.
- Figure 14: Timelines of the development stages of the innovation regions (Slovak innovation region at the top, Czech innovation region at the bottom).
- Figure 15: Visual data from school 1 and school 2 conducted during a focus group in the Swedish innovation region ‘Love the Forest’.
- Figure 16: Most important forest ecosystem services as selected by the students of school 1 and 2 in the Swedish innovation region ‘Love the Forest’.
- Figure 17: Photo impressions from different exercises conducted with the students during the focus groups in the Swedish innovation region ‘Love the Forest’.
List of tables
- Table 1: Description of the four levels of participation in the interaction of actors.
- Table 2: Overview of work packages’ (WP) level of support for the four phases of the innovation process.
- Table 3: Overview of which method factsheets were contributed by which work package.
- Table 4: Overview of data of five invited and three non-invited children for further QCA analysis.
- Table 5: Overview of different interview types.
- Table 6: Overview of the basic features of the methods.
- Table 7: Overview of the methods’ suitability to support actor participation, knowledge integration, and in different phases in the innovation process.
- Table 8: Overview of the methods’ suitability to support different strategies for prototyping.
- Table 9: Overview of which methods were applied in which innovation region up until now (10/2019).
- Table 10: Overview of stakeholders categories currently involved in the further development of the innovation in the innovation region ‘Eisenwurzen’.
- Table 11: Results of the thematic analysis from school 1 and school 2 following a drawing activity conducted during a focus group in the Swedish innovation region ‘Love the Forest’.
List of abbreviations
| ABM | Agent-based modelling |
| CINA | Constructive innovation assessment |
| CTA | Constructive technology assessment |
| GSA | Governance situation assessment |
| InnoForESt | Smart information, governance and business Innovations for sustainable supply and payment mechanisms for ForESt Ecosystem Services |
| QCA | Qualitative comparative analysis |
| RBG | Role board games |
| SNA | Social network analysis |
| WP | Work package |
Executive summary
This document presents deliverable (D4.1), on the ‘mixed method matching analysis’, of the InnoForESt project (www.inoforest.eu). It aims to outline all methods put forward in the six thematic work packages of InnoForESt to support the knowledge exchange and co-creation process in the selected innovation regions of the project in order to assess and further develop the existing innovations there and find one or several matching ‘prototype/s’ which describe/s their possible future development pathways, either for up-grading, up-scaling, and/or replication.
In section 1, first some context information on the InnoForESt project as a whole, the specific aims of work package 4 (WP4) and the particular focus of this deliverable D4.1 is provided.
In section 2, the framework for the mixed methods matching analysis (in short referred to as ‘matching framework’) is introduced. The framework considers three main aspects for the analysis: 1) the general context conditions as defined by the InnoForESt project as a whole giving particular emphasis to its dedication to a multi-actors approach, 2) the knowledge exchange and co-creation processes as defined by the knowledge contributions of individual actors involved into the project as well as the interaction of all these actors for knowledge trading and co-production, and 3) the innovation process presenting a phase model which distinguishes four inter-related phases in the innovation process.
In section 3, the methods used by each of the six thematic work package in InnoForESt in order to support the innovation teams in the further development of their innovations through the three prototyping strategies for up-grading, up-scaling, and/or replication are described. Altogether 14 methods are portrayed providing details on the steps involved for their application, the types of results produced, how these results can inform prototype development and assessment in InnoForESt, the particular strengths and weaknesses of the methods, software and materials needed, as well as key references.
In section 4, the 14 methods portrayed are compared against the developed matching framework. To do so, first a comparison is made in regard to the methods specific resource needs in terms of data, time, special expertise, and software. Second, a comparison is made how suitable the methods are in regard to the integration of different types of knowledge differentiating between scientific, practical and other (e.g. bureaucratic/administrative) knowledge. This is followed by a comparison of the methods in regard to ability to provide participation options for multiple actors. Third, a comparison is made in regard to how suitable the methods are to support across several phases of the innovation process. Finally, a comparison of the methods in regard to their ability to support different strategies for prototyping differing between up-grading, up-scaling, and replication is done.
In section 5, reports on the experiences that the different innovation teams have made in the application of the different methods in the selected innovation regions are presented, also highlighting how the methods were adjusted to the respective context conditions, often combining different methodological approaches.
The deliverable closes with some concluding remarks in section 6.
1 Introduction
1.1 About the InnoForESt project in short
InnoForESt is an innovation action funded through the Horizon 2020 program of the European Union. It aims to explore innovative governance approaches in the European forestry sector to spur the increased provision of a wide array of different forest ecosystem services, including provisioning, regulating, cultural, and supporting ecosystem services. To foster the development of innovative governance solutions in the forestry sector for policy and business, it draws from six already existing forest governance innovations, which are interesting for further development and to be up-graded, up-scaled, and potentially replicated. These governance innovations are located in seven European countries: Austria, Finland, Germany, Italy, Slovakia/Czech Republic, and Sweden. Across these initiatives, the project brings together a wide network of actors including science partners, such as universities and research institutes, as well as practice partners, like environmental and forestry agencies, non-governmental organizations, small-and medium sized enterprises, and forest owners and managers. Thereby, the project employs a participatory multi-actor-approach, which puts the real-life needs of the involved practice partners from the forestry and forest-related sectors at the heart of the project. The science partners support the innovation process by facilitating exchange among all involved actors for the mutual assessment and further-development of the selected and already existing innovation initiatives through suitable communication infrastructures and methods. Together, science and practice partners constitute a so-called 'innovation team' in each case study region, in the following referred to as an 'innovation region'.
1.2 About work package 4 in short
Within InnoForESt, work package 4 (WP4) is responsible for establishing so-called 'innovation platforms for policy and business' (in short: 'innovation platforms') which constitute an essential part of the necessary communication infrastructure to support the interaction of the different actors involved in the 'innovation teams' in the different 'innovation regions' . The innovation platforms consist of a physical and a digital component through which knowledge exchange and co-creation processes are supported with the aim to assess and develop the existing innovations further through so-called 'prototyping'. Prototyping involves three different strategies called 'up-grading', 'up-scaling', and 'replication'. Here, up-grading refers to improving an existing innovation within the original area and context, but with a wider scope (e.g. by including additional forest ecosystem services and products). Up-scaling then refers to transferring an existing innovation with the initial scope to a larger geographical area or higher administrative scale, still including the original region and context. Finally, replication refers to making an innovation transferable and applicable for a different region and different context, also adjusting the scope as preferred by the new network of actors.
1.3 About this deliverable in short
Against this backdrop, this deliverable D4.1 on the 'mixed method matching analysis' presents the methods put forward in the different work packages of InnoForESt to support the knowledge exchange and co-creation processes in the InnoForESt innovation teams and other project external stakeholders involved in the innovation regions in order to assess and further develop the existing innovations and find one or several matching prototype/s that describe/s the possible future development pathways of an innovation, either for up-grading, up-scaling, or replication.
Deliverable D4.1 is organized in as follows:
First, we provide some context information on the InnoForESt project (this section).
Second, we introduce the framework for the mixed methods matching analysis (in short referred to as 'matching framework'). For the development of the matching framework, we focussed on knowledge exchange and co-creation processes in the context of innovation development as well as team building, participation and learning processes in the interaction of multiple actors within the innovation teams (see section 2).
Third, we continue with a detailed description of the methods suggested and used by each work package in InnoForESt in order to support the innovation teams in the different innovations regions in the further development of their innovations by matching prototypes to their innovations for up-grading, up-scaling, and/or replication (see section 3).
Fourth, we compare the methods against the developed matching framework, giving particular emphasis to how a concrete method can support the innovation teams in different phases of the innovation process, contribute to the integration of different knowledge types, and allow for the participation of multiple actors (see section 4).
Fifth, we report on the experience that the innovation teams made in the application of the different methods in the six innovation regions, also highlighting how the methods were adjusted to the respective context conditions, often combining different methodological approaches (see section 5).
We close with some concluding remarks (see section 6).
2 Framework development for the mixed methods matching analysis
For the development of the matching framework (Figure 1), we drew from several streams of research focusing on knowledge exchange and co-creation processes in the context of innovation development as well as understanding team building, participation, and learning processes in the interaction of multiple actors (e.g. Edmondson and Harvey 2018, Prager and McKee 2015, Durham et al. 2014, Banks et al. 2013, Mauser et al. 2013, Edelenbos et al. 2011, Pahl-Wostl 2009, Smith 2009).
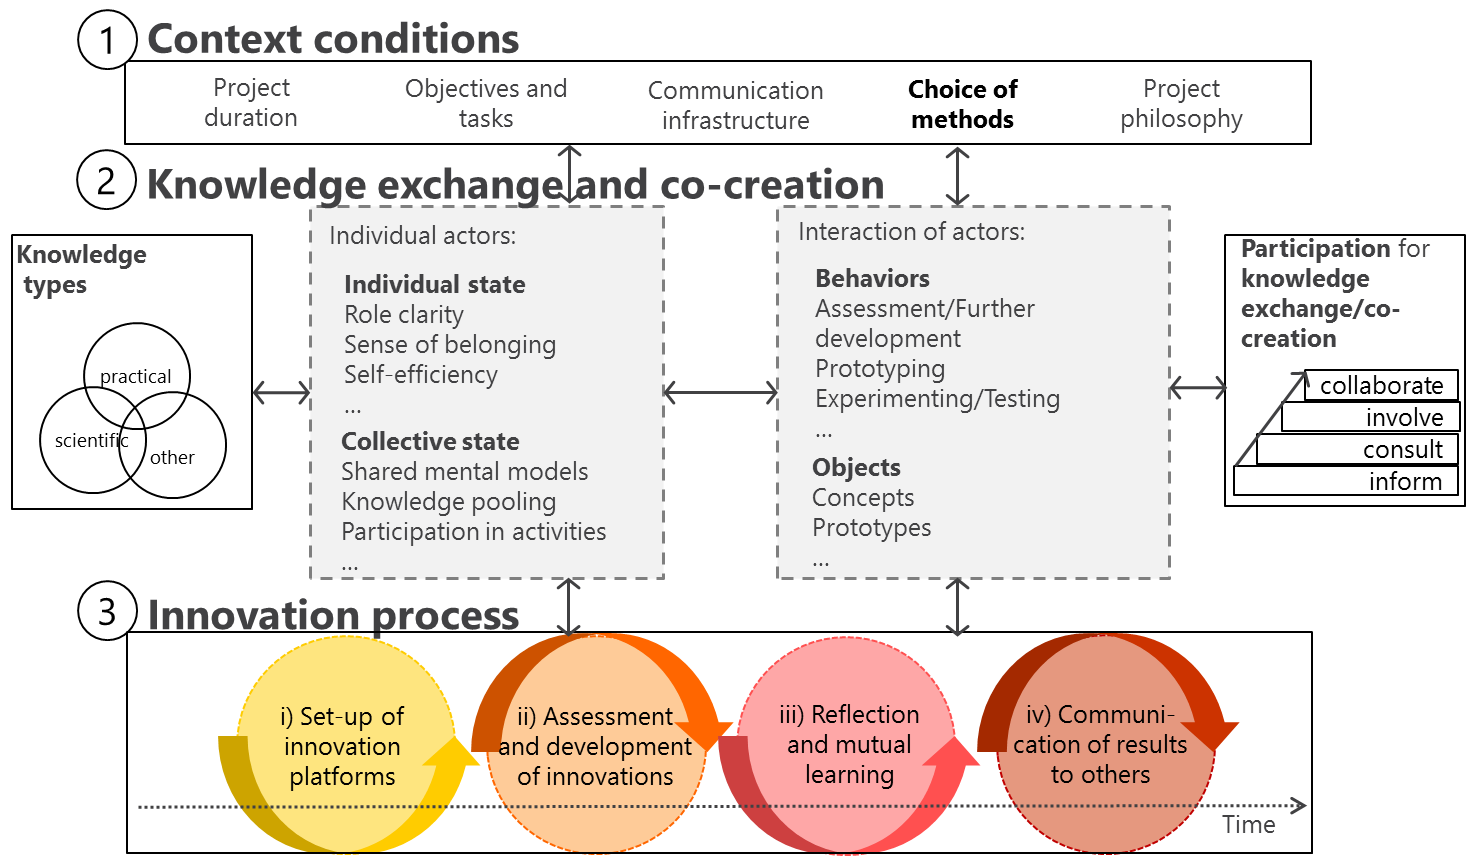
For the framework we consider the following three main aspects for the analysis: context conditions, knowledge exchange and co-creation, and the innovation process.
2.1 Context conditions
The context conditions (aspect 1 in Figure 1) are defined by how the InnoForESt project is set up in general. This includes the overall project duration of 36 months defining the available time frame for all activities, its main objectives and tasks, its basic infrastructure provided for communication (including the innovation platforms of WP4), the methods chosen in all thematic work packages to support the innovation process and the interaction of all involved actors (which is in the focus of this deliverable and thus highlighted in bold). Very importantly, the context conditions also include the underlying philosophy and dedication of implementing the multi-actor-approach required for Horizon 2020 projects (cf. EIP-AGRI 2017) which requires that all project activities should be tailored to the real-life needs of the involved practice partners, focusing on the further development of their innovations through up-grading, up-scaling, or replication.
2.2 Knowledge exchange and co-creation
The knowledge exchange and co-creation (aspect 2 in Figure 1) takes place between all actors in the innovation regions involved through the innovation platforms. This includes the official science and practice partners of the project, but equally important, also other project-external stakeholders from the innovation regions. Overall, involved actors can include a very diverse range of actors from different sectors (e.g. forestry, agriculture, conservation, research), covering public (governmental, state) private (market, for-profit), as well as civil society (third sector, not-for-profit) actors. Hereby, each actor brings a unique set of knowledge and experience (e.g. scientific, practical, other) into the project. This knowledge and experience is shared through the interaction within the network while at the same time new knowledge is co-created, both within the innovation regions and across. Knowledge co-creation emphasizes that knowledge is often socially constructed (e.g. Prager and McKnee 2015). Based on Edelenbos et al. (2011), knowledge co-production refers to the interaction of diverse actors with the aim of 'exchanging, combining and harmonizing elements like facts, interpretations, assumptions and causal relations from their different knowledge domains' (Edelenbos et al. 2011, p. 676). Knowledge co-creation has the potential to lead to more socially relevant knowledge, improved decisions informed by this knowledge, and, ultimately, the ability to better address complex issues (e.g. Prager and McKnee 2015).
Thereby, individual actors switch back and forth between two emergent states, an individual and a collective one (see left inner grey box in Figure 1), since knowledge co-creation refers to how knowledge is processed by the individual actors and how new knowledge is co-created through actors' interaction in a group setting (cf. Prager and McKnee 2015).
For the first, the individual state, relevant issues are, for instance, to get a clear understanding of what one's role and responsibilities are within a single innovation team and to develop a sense of belonging to this team. This includes defining for oneself, how one can best contribute to the team's goals. For the latter, the collective state, it is important to find a common language to ensure shared mental models and mutual understanding when talking about issues. This is important in order to know how individual actors' knowledge can contribute to the issues at hand, which also defines how intensive one's participation in specific/concrete activities will be. However, actors' composition often is not be stable over time, but varies along the development of the innovation, depending on what type of knowledge is needed. Thus, in Figure 1 this box is marked with a dotted line, indicating that individual actors are dropping in and out continuously. Yet, some actors stay with an innovation team constantly belonging to the core team that drives further development.
For the definition of knowledge types that individual actors can contribute to the advancement of the particular innovation, we make a difference between scientific, practical, and other knowledge (left outer box in Figure 1).
Scientific knowledge (often also referred to as expert knowledge, cf. Prager and McKee 2015, Edelenbos et al. 2011) is mostly the outcome of scientific fact-finding and research. Thus, it is mainly the science partners in InnoForESt who contribute to this type of knowledge. Practical knowledge (also referred to as lay, citizen, stakeholder, or non-scientific knowledge, cf. Prager and McKee 2015, Mauser et al. 2013, Edelenbos et al. 2011) results from real-life and on-the-ground local experiences in the innovation regions. In InnoForESt, the practical knowledge is mainly brought in by the practice partners. In addition to scientific and practical knowledge, other types of knowledge might be crucial and necessary as well, but are not available within the InnoForESt innovation teams, yet. In this case, additional project-external stakeholders have to be involved from the innovation regions or beyond. They can then contribute the missing 'other' knowledge, which might include knowledge about the appropriate political-administrative procedures and how established (legal) standards and requirements can be met at national or EU level. Based on Edelenbos et al. (2011), this type of knowledge is referred to as 'bureaucratic' knowledge (also called administrative or policy-maker knowledge, cf. Prager and McKee 2015). However, these three types of knowledge partly overlap, because a single individual can contribute several types of knowledge which makes the boundaries between knowledge types somewhat hard to delineate (cf. Prager and McKee 2015). Edelenbos et al. (2011) also mention that there is heterogeneity within single knowledge types, for instance, between the knowledge that natural and social scientists can contribute to scientific knowledge.
Consequently, we differentiate between four interfaces for knowledge exchange and co-creation in our framework (see Figure 2).
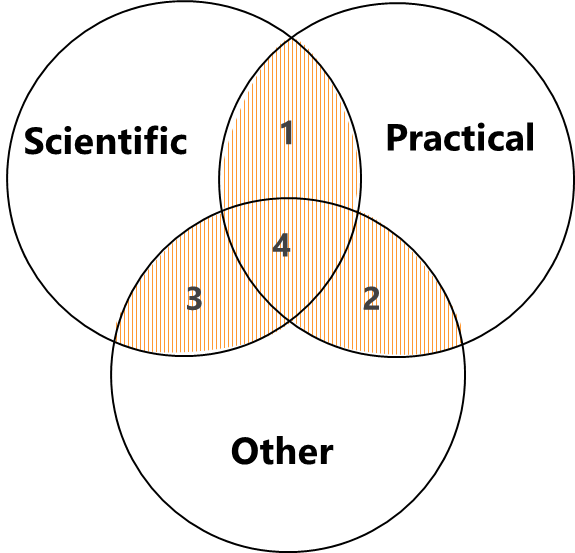 |
Legend:
1 = Interface between scientific and practical knowledge, corresponding to knowledge exchange and co-creation between InnoForESt science and practice partners 2 = Interface between practical and other (e.g. bureaucratic) knowledge, corresponding to knowledge exchange between InnoForESt practice partners and other project-external stakeholders in the innovation regions 3 = Interface between scientific and other (e.g. bureaucratic) knowledge, corresponding to knowledge exchange between InnoForESt science partners and other project-external stakeholders in the innovation regions 4 = Interface between scientific, practical and other (e.g. bureaucratic) knowledge, corresponding to knowledge exchange between InnoForESt science and practice partners and other project-external stakeholders in the innovation regions |
Actors' interactions (right inner grey box in Figure 1) then can be described through actors' behaviors in regards to the assessment and further development of the innovations, the prototyping for up-grading, up-scaling, or replication strategies, as well as the experimentation and testing of selected prototypes to probe if they are applicable in practice. During their interaction, actors co-create specific objects, which are helpful for their work, such as mutually-understood concepts, like the ecosystem services concept or the concept of social-ecological systems, which inform their interaction, or the defined prototypes for the further development of the particular innovation. These objects can also take the form of a boundary object (cf. Abson et al. 2014), i.e., something that is mutually shared by different communities (from practice, science, and policy), because it looks the same, but is referred to and interpreted differently by each group. Boundary objects, such as the ecosystem services concept, may appeal to different types of actors likewise and can link them together via collaboration on a common task (cf. Star and Griesemer 1989). In Figure 1, box 'interaction of actors', just like box 'individual actors', is marked with a dotted line to indicate that actors might by dropping in and out of the process of knowledge sharing and co-creation, because they might not be part of the interaction continuously.
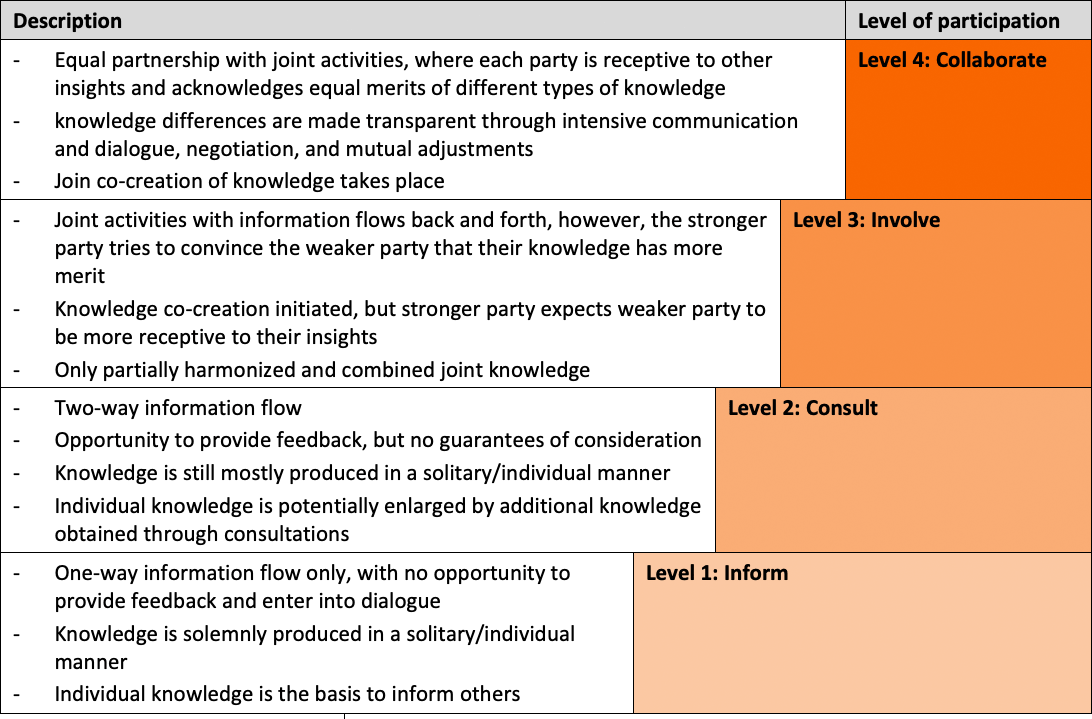
For defining different levels of actors' participation (right outer box in Figure 1) in the interaction with each other for knowledge exchange and co-creation we refer to Durham et al. (2014) and distinguish four levels: inform, consult, involve, and collaborate, where the level of participation continuously intensifies (cf. Arnstein 1969).
While 'inform' means only a one-way-information flow where one actor is provided with information with no opportunity to give feedback, 'consult' equals a situation with a two-way information flow, where also feedback is possible, although without the guarantee that feedback is always taken into full consideration when proceeding further. By contrast, 'involve' means that activities are conducted together, but one party holds relatively more bargaining power in this process, thus leading the other(s). Finally, 'collaborate' denotes equal partnership at eye level where all activities are planned and implemented together by the involved actors. Since InnoForESt employs a multi-actor-approach it has a strong focus on methods that allow for high levels of participation.
In Table 1, more detail on the differences between the four levels of participation is provided.
The general benefits of high levels of participation (cf. Smith 2009) include:
- higher credibility of the produced results, since all participating groups can contribute their knowledge,
- higher relevance of the produced results as participants can ensure that they are more likely to be tailored to their specific needs,
- higher ownership, as all actors are able to better understand underlying assumptions and conceptual models that were used to produce the results, and
- higher perceived legitimacy of decisions made based on mutually produced results, provided that decision making was also done in a participatory and democratic manner, which finally results in higher acceptance of and higher compliance with these decisions.
However, high levels of participation also come with some costs. This includes, for instance, additional time resources required for more in-depth involvement or higher expenses for travelling to attend meetings, etc. We also like to emphasize here that a high level of participation is not always needed from all actor groups and that the level of involvement is the outcome of a negation process taking into account actors' needs and availabilities.
2.3 Innovation process
To describe the single steps in the innovation process (aspect 3 in Figure 1), for WP4, we roughly distinguish four phases:
- phase i): set-up of the innovation platform,
- phase ii) assessment and further development of the innovation (including prototyping),
- phase iii) reflection and mutual learning, and
- phase iv) communicating results to the outside world.
For each phase, the different work packages of InnoForESt are meant to support the activities of the innovation teams through specific methodological inputs (see also Table 2 below).
In phase i), to create the necessary communication infrastructure for the interaction of all team members, the innovation platforms were set up. For each innovation region, they always consist of a physical and a digital component.
The physical component of the innovation platforms exists through a diversity of different physical meetings, but also office spaces, where involved actors in each innovation region can meet in person to hold smaller and bigger work meetings as well as workshops (e.g. CTA/CINA workshops, see more details provided in section 3). Participants of these events can include official members of the innovation team (both science and practice partners), but very importantly also project-external stakeholders from one/several innovation region/s or invited experts from outside these regions, including national or international experts. Physical meeting spaces are, for instance, the offices of the InnoForESt practice partners, but also additionally rented venues for accommodating workshops. Meetings can be strategically planned (e.g. CTA/CINA workshops), but also include many smaller complementary and spontaneous meetings. These are organized based on the needs resulting from the ongoing innovation process and the work routines of the practice partners. The physical component also included basic office tools for communication (e.g. a landline, fax machine)
The digital component of the innovation platforms serves as a virtual space for knowledge exchange and co-creation and is realized as sub-menus linked to the InnoForESt website (www.innoforest.eu, please see specific sub-menus under the main menu 'Innovations in focus'). It supplements the physical component of the innovation platforms to allow also for exchange through digital means. It is further subdivided into: i) a general part which is open to the public to present the innovation in the respective local language and in English, and ii) a protected part that each innovation region can use for managing the innovation process and sharing information internally with their local network of stakeholders (mostly in the local language).
In phase ii), for the assessment and further development of the innovation in each innovation region, the innovation teams together with project-external stakeholders first investigate the strengths and limitations of the current status of their innovation and then start out to define one or several prototypes for its further development. A prototype can be understood as a vision of an innovation that describes the future development of the innovation. It can be understood as a scenario, model, sample, or early release of a product built to test a concept, process or production procedure in order to study and learn from it. Future development directions are agreed upon by the innovation teams together with other involved project-external stakeholders in the innovation regions. Thereby, a new prototype is based on the re-configuration of the defining factors of the innovation, which is assumed to improve the profile of the original innovation.
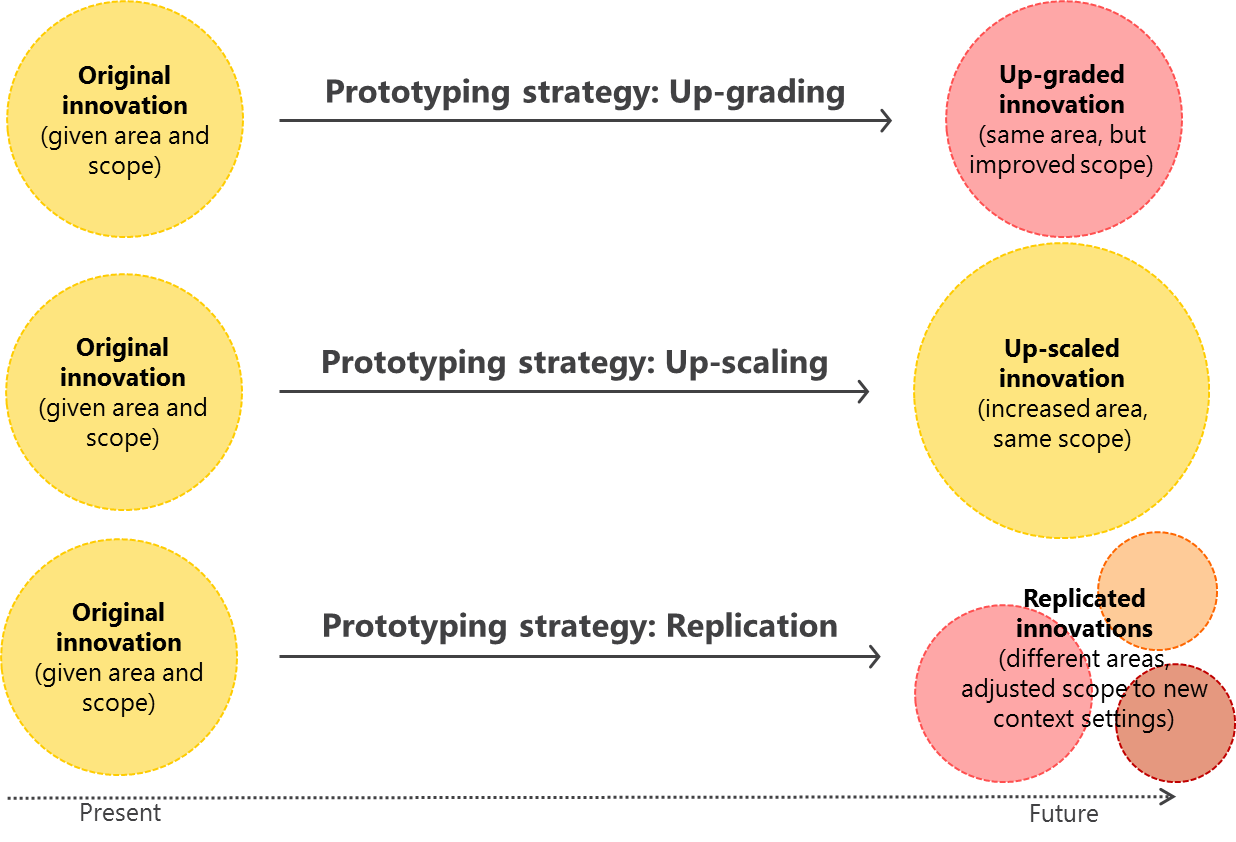
Altogether, three different strategies for prototyping of the already existing innovations can be differentiated (cf. Maier and Grossmann 2019, InnoForESt deliverable D6.2, for a more detailed description of the different strategies, including examples from the innovation regions):
- Up-grading, which refers to improving an existing innovation within the original area and context, but with a wider scope (e.g. by considering additional forest ecosystem services, improving the quality of the provided services and related products, further developing the chosen governance mechanism, or improving marketing strategies to attract further customers).
- Up-scaling, which refers to transferring an existing innovation with an initial geographical scope to a larger geographical area or higher administrative level, still including the original region and context (e.g. by raising demand for the provided forest ecosystem services and related products beyond the original area, engaging additional stakeholders with similar interests to increase the supply, including additional forest ecosystem services from another area to create a wider portfolio of offered services).
- Replication, which refers to making an innovation transferable and applicable for a different region and context, also adjusting the scope as preferred by the new network of actors (e.g. by designing communication measures to make others aware of the original innovation in order to make them think about copying and transferring it to their own region, providing guidance and advice to the new set of actors on how to adapt it to their specific context conditions in case it cannot be copied one-to-one, and replicating a funding mechanism for a new forest ecosystem service in the new area)
Figure 3 depicts the differences between the three prototyping strategies. However, hybrids of these strategies are possible.
In phase iii), reflection and mutual learning is supported, both between the different innovation regions, but also between the different work packages. In WP4, this is encouraged through regular exchange of experiences among teams, for example, by conducting cross innovation region and cross work package Skype meetings about every three months, and also by stimulating the innovation teams to reflect and document their positive as well as negative experiences. To do so, different templates (e.g. the feedback sheets, see section 3.8) are provided. In this way, the documented reflections can offer inspiration and learning possibilities for the other teams. According to Pahl-Wostl (2009), learning takes place at multiple levels as well as in multiple loops, introducing a concept for triple-loop learning, which seems also useful in view of the prototyping. While the first loop of learning aims at improving something that already exists, the second loop of learning aims at reframing, and, finally, the third loop calls for transformation. While the first loop seems mostly relevant in view of the prototyping strategy of up-grading', second- and triple-loop learning seem necessary for the prototyping strategies of up-grading and replication.
In phase iv), results are communicated through different communication channels, including the physical and digital components of the innovation platforms. Applicable communication formats are diverse and include a wide array of written, audio, and video materials.
Altogether, we like to emphasize here that all phases do not necessarily happen in a linear way, i.e.one after the other, but usually rather in parallel, interconnected by many feedback loops, resulting in several iterative cycles (as indicated in Figure 1 by the cyclic arrows).
In all four phases, the innovation teams in the different innovation regions were supported by the activities conducted in the different work packages of InnoForESt, each work package with another particular focus. Table 2 provides an overview which work package is supporting in which phases through specific methodological input. The degree of shading thereby serves as an indication for the intensity of the support.
 |
||||
|---|---|---|---|---|
| WP2: Mapping and assessing forest ecosystem services and institutional frameworks |
||||
| WP3: Smart ecosystem services governance innovations |
||||
| WP4: Innovation platforms for policy and business |
||||
| WP5: Innovation process integration |
||||
| WP6: Policy and business recommendations and dissemination |
||||
| Legend: | ||||
| = work package of low support in the respective phase | ||||
| = work package of moderate support in the respective phase | ||||
| = work package of high support in the respective phase | ||||
| = work package without specific support in the respective phase | ||||
3. Description of suggested methods for the matching analysis
In this section, we present a detailed description of the methods suggested and applied by each work package to support the innovation teams in the innovations regions in the further development of their innovations and matching prototypes.
For each suggested method, a factsheet is provided which is structured in a similar way based on a template containing the following headings:
- Name of method
- Author/s of method factsheet
- Short description of method
- Steps involved
- Results produced
- How results can inform prototype development and assessment in InnoForESt
- Strengths and weaknesses of the method
- Software and materials needed
- Key references
- Contact info of InnoForESt experts who can be contacted to obtain further information
The inputs for the method descriptions were provided by the individual work package teams of InnoForESt and the respective authors are specified for each sub-section.
Thereby the teams were free to either describe the method in more general terms also pointing out alternative ways in their application, or focus the description on how the method was specifically applied in InnoForESt.
Table 3 provides an overview of which methods were contributed by which work package(s).
| Work package | Contributed method factsheet(s) |
|---|---|
| WP2: Mapping and assessing forest ecosystem services and institutional frameworks |
|
| WP3: Smart ecosystem services governance innovations |
|
| WP4: Innovation platforms for policy and business |
|
| WP5: Innovation process integration |
|
| WP6: Policy and business recommendations and dissemination |
|
3.1 Institutional and bio-physical mapping
Author/s of method factsheet:
Liisa Varumo and Eeva Primmer
Short description of method:
In response to the task of mapping and assessing forest ecosystem services and institutional frameworks (WP2) the decision was made to analyze policy strategies, laws, and other policy documents at regional, national, and EU level. For the countries of the innovation regions and at EU level, at least three documents which included the forest strategies and laws, as well as the biodiversity and bio-economy strategies were analyzed. For additional European countries only the forest strategy or equivalent was taken into account. Based on the factors/variables that were to be analyzed from the documents we constructed a questionnaire for the analysis. Thereby, for the persons who filled in the questionnaire, the aim was not to complete the questionnaire based on own personal knowledge, but strictly limited to the information presented in the policy documents. All information from the questionnaire was then fed into a database. In preparation of the questionnaire, all factors/variables (e.g. which types of forest ecosystem services, governance actors, governance and forest management systems to consider) were developed together with all WPs to ensure that they would be as coherent as possible across WPs. The questionnaire included also some background data of the documents. The questionnaire was designed to have mainly multiple-choice questions producing quantitative comparable data across regions, but also open questions for more detailed qualitative answers were provided. Per analyzed policy document, the questionnaire was to be filled in 10 times, once each for a total of 10 forest ecosystems services taken into account. As an output, a comprehensive database in Excel format was created which prospectively could be used to create spatial maps that also could be overlaid with the additional spatial information from biophysical mapping.
Steps involved:
- As a first step, we conducted a quick scan of academic and grey literature on existing comparisons of forests and forest ecosystem services relevant policy documents and forest management systems to organize the development of the database and determine the appropriate data sources (e.g. Bouwma et al. 2018). From this initial scan we got a basic idea on how the analysis could be conducted and what types of documents could serve as the basis for our analysis.
- In a second step, the method for data collection was developed with a very strong focus on the envisioned final output, a database, and its technical usability for InnoForESt. Initially we considered having people fill in directly an Excel sheet with the factors, but the questionnaire was seen as a more user-friendly approach to collect the data. We also considered if other sources than policy documents could be used, i.e. personal knowledge, knowledge already contained in academic literature, etc., but eventually decided that focusing the analysis on policy documents would generate the most comparable data across the innovation regions.
- In a third step, the method for retrieving the data entries from the policy documents was decided upon. Here, the person who was going to conduct the document analysis was instructed to first read each document in one-go to get a general idea about its core contents. Then, the person was to re-read the document once again, and while re-reading it, retrieve all the relevant information for one of the 10 concrete forest ecosystem service simultaneously completing the questionnaire. Thereby, each person was free to decide, if they preferred to either first complete the analysis in a word document with the questionnaire and then enter the responses into the online questionnaire or directly fill in the online questionnaire. For detailed instructions for the step-by-step document analysis a manual was created.
- In a last step, all information from the questionnaire was entered into the database from where we extracted all information necessary for the final analysis of comparing the analyzed regions (see below).
Results produced (examples):
As mentioned above, the final outcome produced is a database in the format of an Excel sheet which contains mainly quantitative information which was further analyzed in SPSS to create cross tabulations showing the different factors/variables and so see which of these factors/variables show correlations (or a lack thereof) between them. This information was then used for a preliminary and rather speculative analysis of how the different analyzed policy documents might aid or guide in the future emergence or development of innovations and different governance mechanisms.
How results can inform prototype development and assessment in InnoForESt:
Once the database is usable online, the InnoForESt team members should be able to search for different factor combinations to see what types of innovations exist in the presence of which factors or combinations thereof, also in regard to the biophysical conditions. For example, one could search for a certain actor, certain forest ecosystem service(s), or biophysical condition and then see what types of innovations (if any) are present in the database or vice versa, or one can search for the innovation and see what factors are present in its respective region. To enable such a search mechanism, the platform, user interface, and the overlaying of the two mappings are still under development.
Strengths and weaknesses of the method:
Strengths:
- Based on the manual, further iterations of the questionnaire to analyze additional policy documents is straightforward and rather self-explanatory
- The structure of the database also easily allows for the integration of additional factors/variables to be considered for the analysis
- Altogether, a low level of expertise is required to do the analysis by following the instructions laid out in the manual
- The method allows for making timelines where you could see how past strategies have addressed different forest ecosystem services and factors related to them, and construct thus 'pathways' or trends. However, not all countries have previous versions of the documents if, for example, the sector is quite new. This would restrict the options for this type of analysis further.
Weaknesses:
- A challenge of the method is calibrating the responses when several people are doing the document analysis. Even if you instruct people to only respond to the questionnaire based on the content of the document, previous knowledge will likely influence the interpretation.
- In questions where you had to give a weight/importance to, for example, an addressed forest ecosystem service, the question 'compared to what?' easily came to mind: a higher weight compared to other mentioned forest ecosystem services in the document or compared to other strategies, countries, etc.?
Software and materials needed:
A manual was produced as the database questionnaire was developed. The manual includes some clarifications to key terms (such as innovation) and examples on most questions and responses and how to evaluate/give weight to the factors/variables on ordinal scales. For the first round of analysis three online training sessions were organized for people doing the analysis. In these sessions, we aimed to also improve calibration by having everyone analyze certain forest ecosystem services from the EU Forest Strategy and then discussing whether we had given similar responses in the questionnaire.
The software used for the questionnaire was an online survey tool called Webropol (https://webropol.com), which requires a license. The strength of the software is that it allows for very diverse question types and the outputs can be filtered and extracted in diverse formats such as *.csv, *.xcl, *.doc, or *.pdf. For the analysis of the quantitative outputs the software SPSS was used. For the analysis of the qualitative outputs created by the open questions the responses were extracted and analyzed and coded in Microsoft Excel.
Key references:
Contact info:
- Eeva Primmer: eeva.primmer@ymparisto.fi
- Liisa Varumo: liisa.varumo@ymparisto.fi
- All contributors of D2.1 (cf. Primmer et al. 2018), who participated in the document analysis for the institutional and bio-physical mapping for the individual innovation regions.
3.2 Role board games
Author/s of method factsheet:
Martin Spacek, Veronika Gezik, Tatiana Kluvankova and Viera Bastakova
Short description of method:
It is extremely difficult to predict human behavior because human decision-making is affected by a wide range of aspects and preferences. One of the tools that can be used to reduce the insecurity of designing new governance measures and mechanisms is the application of experiments and games in both laboratory and field conditions. With their application it becomes possible to confirm or reject the predictions of a certain behavior. In the case of role board games, the benefits extend to supporting education and raising awareness of studied issues. In social sciences, experiments are usually used to analyze and predict individual and group behavior in a controlled situation and test novel instruments and decision tools in real-world situations.
Experiments enable testing, i.e. verifying or falsifying a hypothesis based on potential causal relations in a particular situation. They allow for studying behavioral reactions to changes in variables. A laboratory experiment is repeatable under the same, well-defined and measurable conditions as the procedure of the experiment is described accurately and in detail. A field experiment, on the other hand, takes place in the natural environment of the participants where they feel more at ease and which is familiar to them. Experiments usually provides 'yes' or 'no' answers. Against this backdrop, role board games (RBG) can help to overcome some limits of experiments and enable to study wider consequences and provide at least a partial answer to 'why'. RBGs can also be repeated under controlled conditions, but increase the validity of experiments in real-life situations.
Steps involved:
The application of the method is divided into two main steps: i) designing and adapting the game to a specific context, and ii) its implementation in a given context.
For the first step, i) designing and adapting the game to a specific context, the RBG can be adapted from an already existing experimental design (following the approach outlined by Castillo et al. 2013). Therefore, the logic of the experiment is discussed with the partners in the field and is adapted based on their knowledge. Adaptation is focused mainly on the context, composition of the key roles of stakeholders as well as on the specific innovation factors and approaches in each group. Despite the adaptation, the research team has to keep the basic parameters of the game unchanged for comparability of the results and its replications. The whole process of adaptation takes approximately three months. Before its own application a pilot testing of the game design is needed.
The second step, ii) the implementation in a given context, requires the involvement of at least one moderator to guide the game and one assistant (ideally two of them) for calculation of the game results and collection of the answer sheets or documentation of the narratives. This step involves the following sub-steps:
- Preparation for the game – preparation of the board with resource units, players' cards, decision sheets, etc. (30 minutes)
- Explanation of the rules (15-20 minutes).
- Game playing (60 minutes).
- Short survey on decision reasoning and calculation of the group results (5 minutes).
- Focus group discussion: game results and comparison (25 minutes).
- Payment of earnings to stakeholders (5 minutes).
It is recommended that during the game an assistant and a moderator are taking notes, especially about the mood of the participants or their interest in the game, potential disturbances (outside noise, weather, etc.), interpersonal relations among actors (e.g. whether some of them are friends or colleagues), and the activities of individual players.
Results produced (examples):
The method provides both quantitative and qualitative results. Qualitative results are coming from the analysis of the discussions and interactions of the players during the game as well as from the following focus group where results from the game are discussed, looking at different game stages, interactions among players, and the differences to the reality. Quantitative results show the comparison of the cooperative and private (Nash equilibrium) strategy with the real strategy of the group of players during the game. In the forest context, the results display the harvesting strategy, income of the group or remaining resource units throughout the whole game. When the number of participants is high enough also statistical analysis can be applied to compare the effects of different factors and/or the results between different groups of actors.
How results can inform prototype development and assessment in InnoForESt:
In InnoForESt, the RBGs are meant to test the re-combination of innovation factors in a real-world setting and its effect on actors' behavior. It is part of the prototype development for the different existing innovations. It enables stakeholders from the innovation regions to test different prototyping strategies and learn about their potential effects, discuss necessary adaptations to the respective context conditions, and for increasing collaborative capacity and trust.
In order to get a better understanding of the impact of key innovation factors for the innovation regions, we designed a behavioral [lab] experiment in the form of a RBG that is specifically tailored to InnoForESt.
The main question addressed by this RBG is:
- How to create conditions to enable innovations for sustainable use and well-being in innovation regions under the diverging interests of forest ecosystem services users?
We plan to test combinations of key innovation factors for innovation prototype development as preferred future prototypes for sustainable forest ecosystem services provision in the innovation regions. Thereby, we consider different policy interventions, such as strict regulation vs. various types of payments for ecosystem services schemes, business incentives and external risk factors, such as climate events, depopulation, migration, and market risks). The proposed design for the RBG builds on Cardenas et al. (2013) and Castillo et al. (2011) as an interactive agent-based model arranging for repeated interaction and learning in real-world situations. It contributes to testing the effectiveness of different interventions for the sustainable provision of forest ecosystem services and the acceptance of such interventions by forest ecosystem services users.
The RBG sessions create a situation in which a group of five forest ecosystem services users representing different actor groups (see Figure 5) makes mutual decisions about the use and management of a forest ecosystem and the related forest ecosystem services provision. In the game, one of the actors, for instance, will be representing an 'external actor' representing an authority (e.g. national park, regional office, government, or bank) external to forest use but with regulatory, sanctioning, and monitoring power. The role of other actors can be adjusted to the needs of the specific innovation region.
During each session, the players are then confronted with fostering or hindering context conditions (e.g. in regard to the local climate, economy, governance, rules restrictions, and innovation potential) as well as different actors' values and interests. The actors will face a change in the conditions/factors (individual/collective action, diversity of rules, innovation factors, external events and disturbances, etc.) and will be able to observe/test what conditions lead to a more successful collaboration for sustainable forest ecosystem services provision in the specific context in the innovation regions. This approach will create a space to test innovation activities for prototype development (reflecting the three prototyping strategies up-grading, up-scaling, or replication).
Strengths and weaknesses of the method:
Strengths:
The method can be used as a learning tool for the involved players which allows for studying the effects of particular interventions on the decision making and behavior of the different actors represented. It provides the researcher with a high level of control over different variables involved and provides specific results and conclusions. The experimental design also allows the replicability of the method.
Weaknesses:
Only a limited number of the potential factors that could be changed can be studied in each session. Also, sometimes it can result in unrealistic results due to human errors or to artificial situations (which are not present in a real-life environment). Furthermore, the design of the game requires expertise in this particular field of research, and the implementation of RBGs is time consuming. Experimental research itself does not provide an explanation of the results. Limitation of the experiment is also a lack of external validity given by the simplicity of the design, its abstract nature, the limited number of participants and the knowledge types they represent, and the short time period in which decisions have to be made.
Software and materials needed:
- Playing board with gaming material
- Tool for calculation of probability (e.g. different types of dices)
- Software for calculation and display of the results (it can be done by MS Excel where there is predefined the functionality based on the automatic calculation of the results). Alternatively it can also be done only on paper.
Key references:
Contact info:
- Tatiana Kluvankova: tana@cetip.sk
- Martin Spacek: admin@cetip.sk
- Veronika Gezik: veronikagezik@gmail.com
3.3 Constructive innovation assessment
Author/s of method factsheet:
Peter Stegmaier, Ewert Aukes and Christian Schleyer
Short description of method:
The method constructive innovation assessment (CINA) is based on a methodology previously developed for assessing newly emerging technologies called constructive technology assessment (CTA). CINA/CTA is inherently adjustable to different contexts of use (please see also https://cta-toolbox.nl). CINA provides a workshop-based learning forum for all participants. Though research is needed for preparing CINA workshops thoroughly and also to analyze the results, it is not only research. Rather, the main goal is to bring a variety of stakeholders together and facilitate their exploration of innovations for the governance of forest ecosystem services they find relevant.
In the case of InnoForESt, CINA is mainly about developing alternative scenarios for different governance innovations by getting all concerned actors together at an early enough stage of a development (i.e. when modifications are still possible). In doing so, concerned actors can early on 'insert' considerations into the developmental process that 'improve' what is emerging: in other words, to modulate ongoing developments through 'constructive dialogues'. Therefore, it is crucial to include all relevant actors in a given field. Relevant actors are not only all the 'usual suspects', but also those others who are not yet there, but of which an innovation team thinks they could indeed provide interesting or even decisive new impulses in terms of knowledge, information, or human and other resources. The ultimate aim is to offer the participants new, additional insights from and networking opportunities with people they would normally not talk to. Rather than feeling like research subjects answering research requests, participants should, first and foremost, experience additional value for their own purposes. In order to guarantee this, the set-up of the workshops needs to be absolutely clear about stakeholders' views and highly sensitive to their interests (please see also method description on stakeholder analysis).
Steps involved:
- Scenario development and prototyping: done by the innovation regions themselves, realistic enough and thought provoking at the same time; leaving options for assessing different paths the prototype development and side-conditions could emerge to.
- Case descriptions: broad enough, but also with detail; sound research about the structure of the situation into which the forest ecosystem services innovation shall be introduced or in which they could further be pursued in terms of the de-facto conditions, pre-history, and expected developments that actually characterize the case constellations as of now.
- Actor maps and typologies: including a list of actors that are (a) able to represent a specific stakeholder view authoritatively (expertise, specialization), and (b) able to express their views very well (skilled and interested in communicative exchange), while (c) also being capable of out-of-the-box thinking (creativity, openness). The stakeholder analysis in WP5 is crucial here.
- Prototype assessment: crucial point of reference for the CINA workshops: either in terms of scenarios for choosing prototypes most promising for further development or for assessing scenarios of conditions under which specific prototypes could be proven more or less viable.
- Training innovation teams: achieve a basic understanding of the method and comparability of workshop results; there will be reports from all CINA workshops and the individual case workshops will also be compared, as well as the method assessed
- Carry out CINA workshop: Decision on when in the process to use CINA workshops for what purpose
Results produced (examples):
In cases where CINA has already been used, the following results have been produced, for in-stance (when transferring it to InnoForESt, just replace the technical application with 'forest ecosystem governance innovation' in the given examples below):
Example 1: Socio-technical scenarios of nano-technology in food packaging
One example of a set of socio-technical scenarios has been described by Rip and te Kulve (2007) where they propose multiples futures for nanotechnology in the food packaging domain. The elaborate and complex scenarios are visualized in Figure 6 below in a simplified form.
How results can inform prototype development and assessment in InnoForESt:
The CINA workshop format is implemented as structured interactions focusing on forest ecosystem services innovation 'scenarios'. These are realistic narratives that invite all kinds of relevant stakeholders to probe conditions under which specific prototypical arrangements could be successful or leading to rather less-desired consequences (cf. https://cta-toolbox.nl/tools/scenarios/#aim). The CINA workshops will either lead to a choice of scenarios for further developing specific prototypes – or, after having chosen concrete prototypes, assessing scenarios of conditions under which the prototypes might become (more) viable.
Strengths & weaknesses of the method:
Strengths:
- Reveals underlying argumentations and potential conflicts
- Lays basis for constructive deliberative intervention
- Provides avenues for, possibly modulated, continuation of the innovation
- Can be done on the basis of existing knowledge about the situation, also through consulting case experts, although most often some additional digging and collecting of competing viewpoints is advised (scenario development)
- Requires intensive familiarization with the innovation context
Weaknesses:
- Requires basic experience in social science or policy analysis
- Is tailor-made for specific innovation context; i.e. not simply generalizable to other contexts
- Requires a sufficient level of time investment for scenario development and training to be successful and useful
Software/Materials needed:
With respect to the required entourage, CINA workshops differ only slightly from other kinds of workshops. A physical location is preferred over a virtual one. A moderator is needed who is familiar with the CINA approach and different kinds of moderation techniques. Additional material may involve documentation techniques. These may include audio- and/or video-recording, written minutes, but also visual aids such as brown paper, post-it, stickers, and pens.
Key references:
Contact info:
- Peter Stegmaier: p.stegmaier@utwente.nl
- Ewert Aukes: e.j.aukes@utwente.nl
- Christian Schleyer: christian.schleyer@uibk.ac.at
3.4 Governance situation assessment
Author/s of method factsheet:
Peter Stegmaier, Ewert Aukes and Christian Schleyer
Short description of method:
The governance situation assessment (GSA) is a descriptive tool to chart configurations of actors, institutional arrangements, policy instruments, policies, and politics in place in a certain innovation context. The GSA is not a scientific data analysis method per se, but provides a way of gaining a general overview of the real-life, on-the-ground development of an innovation (Colebatch 2009). The GSA zooms in on the political order of an innovation, how it emerges, stabilizes, is maintained, or even de-aligned. It generates the necessary understanding of the innovation's political, institutional, and physical order for a) nurturing a stakeholder network as well as b) setting up and carrying out workshops aiming at articulating and probing viable alternatives for innovating the governance of a forest ecosystem service.
In the course of the project, it has become more and more apparent that some socio-political situations are simply not yet ready for an actual innovation to be developed. It is very much possible that a process of considerable groundwork has to precede the work on actual innovations. This groundwork can include the exploration of decision-making traditions and cultures in practice, the physical bringing together of stakeholders, as well as the breaking up of entrenched structures. Working together constructively in workshops following the Constructive Innovation Assessment approach is not a walk in the park and cannot be taken for granted. Circumstances allowing for a free flow of ideas and an open discussion of possible futures sometimes need to be established in a tedious process of suggesting out-of-the-ordinary possibilities and stimulating out-of-the-box, creative thinking. Revealing such entrenched structures and the necessity to create constructive circumstances can be achieved by preparatory work through the GSA.
By means of a list of questions to be answered, the societal context of a (planned) innovation is mapped. These questions deal with a) actors, included in and excluded from current innovation processes, and what political interests they pursue, b) how, from a governance perspective, these actors relate to each other in the policy realm, c) what the history of the innovation is, d) what the current state of the innovation is, and e) which future developments are currently expected for the innovation.
Additionally, a specific aspect of the GSA is assessing which key problems actors perceive (cf. Hoppe 2010). This aims at the big picture. If one intends to develop the innovation in question in a socially accepted way with broader societal support, knowing about existing problem perspectives is useful knowledge, too. Roughly, problems may arise due to two disagreements. Either actors have not reached consensus about the norms and values relating to the innovation yet, or they may disagree about the knowledge. These two dimensions of problems lead to three types of problems. First, 'unstructured problems' describe situations in which actors neither agree on the norms and values nor on the necessary and available knowledge. Second, if there are 'moderately structured problems', actors have reached consensus either about the norms and values involved or about the required and available knowledge. Third, if consensus has been reached about the norms and values as well as the required and available knowledge, one can speak of a 'structured problem'.
All these descriptive data produce an overview of the governance context of a certain innovation. Due to their descriptive nature, they have practical as well as analytical use. On the one hand, the GSA data can directly be used by actors in the innovation context to bring other actors together and increase support for the innovation. From an analytical point of view, on the other hand, the GSA data lend themselves for further analysis with different data analysis methods, both qualitative and quantitative.
Steps involved:
- Familiarization with the generic list of questions
- Adaptation of the generic question list to the specific innovation context
- Answering the questions based on pre-existent knowledge and/or additional data generation
Results produced (examples):
The results for this method can take different forms depending on the level of data processing efforts one is willing to invest. The basic results are textual answers to the questions. However, as mentioned previously, the basic, textual GSA data lend themselves for further analysis with different methods. The data can also feed into a more extensive stakeholder analysis, certain types of social network analysis (SNA), or discourse analysis. In sum, the results of the GSA have descriptive value in itself as well as constituting a thorough qualitative data basis for further, more sophisticated types of analysis. As the method has, to a large degree, been specifically developed for InnoForESt the availability of examples is limited.
How results can inform prototype development and assessment in InnoForESt:
Carried out at an early stage, GSA helps to formulate and select alternatives of innovations. On the basis of this, a prototype can be developed by considering a realistic picture of the political/institutional conditions, under which the innovation and the prototype may be possible.
Strengths & weaknesses of the method:
Strengths:
- Provides a rich picture of the innovation context
- Enables tailoring actor's strategy to other actors in the innovation context
- Reveals underlying argumentations and potential conflicts
- Lays basis for constructive, deliberative intervention
- Can be done on the basis of existing knowledge about the situation, also through consulting case experts, although most often some additional digging and collecting of competing viewpoints is advised
- Requires intensive familiarization with the innovation context
Weaknesses:
- Requires basic experience in social science or policy analysis
- Is tailor-made for specific innovation context; i.e. not simply generalizable to other contexts
- Requires a sufficient level of time investment for data sorting and categorization to be successful and useful
Software and materials needed:
In general, the required materials comprise those necessary for interviewing, if these are even necessary. This would mean, recording devices, informed consent forms, and arrangement of privacy-sensitive interview transcription need to be organized. As regards software, it is not crucial to use a software package to sort through and eventually analyze the data. Having said that, software packages dedicated to qualitative data analysis, such as ATLAS.ti, NVivo, or similar, can be an advantage.
Key references:
Contact info:
- Peter Stegmaier: p.stegmaier@utwente.nl
- Ewert Aukes: e.j.aukes@utwente.nl
- Christian Schleyer: christian.schleyer@uibk.ac.at
3.5 Process Net-Maps
Author/s of method factsheet:
Claudia Sattler
Short description of method:
Process Net-Maps are a novel research tool for an interview-based approach for participatory mapping in social network analysis (SNA) (cf. Lubungu and Birner 2018, Zampa 2017, Raabe et al. 2010). They are a variant of the original Net-Map method developed by Schiffer (2007). While the original Net-Maps focus on the mapping of the status quo of actors' interactions in social networks, Process Net-Maps focus on the mapping of the consecutive steps of a network development process among actors against a timeline, identifying all relevant actors (e.g. idea giver and initiators, resource providers, implementers, or other) and important events (e.g. events organized, agreements made, and contracts negotiated, etc.).
Against this backdrop, for InnoForESt, Process Net-Maps are used to gain a deeper understanding of the history of an innovation process, in particular on the actors involved and the sequence of events that were organized regarding the initiation, the planning and design, and the actual practical implementation of the innovation. They are also used to learn about the motivations of the different actors' to get involved into the innovation process, their influence and power in the interaction with each other, and the benefits they obtain from their involvement. Furthermore, Process Net-Map is also suitable to identify when and why in the development process of the innovation challenges occurred and how these were addressed and overcome or mitigated by the involved actors. Besides this historic and backward-looking analysis, Process Net-Maps can also be used for a forward-looking analysis speculating about possible future development pathways of the innovation for prototypeing, anticipating which additional actors are needed and which future activities and events would be necessary to follow a specific development path.
Steps involved:
The interviews for the Process Net-Maps are divided into two parts (see Figure 7):
- Part A), with a backward-looking analysis, to understand the development process of the innovation up to the present day, and,
- Part B), with a forward-looking analysis to outline possible future developments of the innovation for prototyping.
During the interviews, in parallel to the interview conversation, the innovation process gets visualized on a large sheet of paper, the actual Process Net-Map, by putting all relevant actors and events on post-its which get placed along a timeline.
Thereby, the interviews follow the following interview guideline:
Part A): Questions for backward-looking analysis
Process mapping: Can you tell me about the story of the innovation? When did everything start? How did the innovation develop further step by step? Who were the important actors (e.g. individuals, groups of people, and organizations)? What were the roles of the different actors (e.g. innovator/idea giver, supporter/resource giver, influencer, and implementer)? What were crucial events (e.g. meetings, agreements, contracts, change in policies, and crises/conflicts)? How did these events influence the process (positive or negative)?
In this step, the actors and events get written down on post-its using a color code (e.g. actors on orange post-its, events on yellow post-its) and are arranged along the timeline in dependency on when the actors got involved and when events took place.
Actors' attributes: What was the motivation of each actor to get involved (e.g. motivated by economic, social, and ecological interests)? How influential are the different actors? Which actors obtain the highest benefits?
In this step, the interviewees are free to define the motivations which are usually displayed as icons or symbols which get drawn onto the single actor post-its (e.g. a tree for ecological, a coin for economic, and a heart for social motivations). For indicating the influence and benefits towers are stacked by the interviewees. A maximum of five stacks per tower are allowed. The higher the tower, the greater is the influence, and the benefits of the respective actor. Actors with no influence and/or benefits get no stacks on their actor post-it. The interviewees are allowed to add stacks and also take them away again until they are satisfied with their towers. Eventually the number of stacks in each tower gets also noted down on the actor post-it, again using different colors for the influence and the benefits (e.g. red for influence and green for benefit).
Events' attributes: Which events were positive and pushed the innovation forward? How exactly? Which events were negative and caused difficulties/challenges? How? What was done to overcome the different difficulties/challenges?
In this step, also symbols are used to mark the positive and negative events (e.g. an asterisk for the positive ones and a flash for the negative ones).
Part B): Questions for forward-looking analysis
Process: When you think about the next three (five, ten) years, can you tell me which steps are planned next? Which old/new actors will be important? In which role could InnoForESt support the process as an actor? What events are planned already?
For this step, usually a new sheet is used to start fresh and with lots of space. Old actors get displayed with the same color as in the backward-looking analysis. For new actors a new color (e.g. pink) is used.
Criteria of success and failure: When you think about the future, what criteria would you use to measure success? What criteria would you use to define failures?
For this step, an additional large-format post-it is added to a free corner of the Process Net-Map, on which criteria of success and failure are listed as expressed by the interviewee.
Results produced (examples):
The Process Net-Maps have two types of results: first, the actual physical Process Net-Maps visualizing all important actors and events from the backward- and forward-looking analysis, and, second, the audio-recording of the interview. Both are equally important for the analysis. While the physical Process Net-Maps hold mostly quantitative information (e.g. number and kind of actors involved, number and kind of events conducted for innovation development, number and kind of motivations for actors involvement, and number of stacks in the influence and benefits towers), the audio-recordings hold most of the qualitative information that is crucial for interpretation (e.g. why certain actions were pursued or how challenges were mastered). Figure 8 shows an example of a physical Process Net-Maps created in one interview in the Swedish innovation region.
How results can inform prototype development and assessment in InnoForESt:
Especially the forward-looking analysis (part B) is helpful to outline possible future developments of the innovation and explore different options of prototyping (up-grading, up-scaling, replication, or hybrids thereof). It can also be used to speculate about a 'best case' (complete success) and contrast it against a 'worst-case' scenario to anticipate possible obstacles and set-backs and think about how to best deal with them in advance. This way the innovation teams can create a contingency plan to get prepared in case some things will not go according to plan.
Strengths and weaknesses of the method:
Strengths:
- Yields rich data, including both quantitative and qualitative information
- Elicits implicit knowledge on all important steps in the development process of the innovation
- Helps to identify particular challenges in the innovation process and how they were dealt with
- Communicated information during the interviews gets visualized in the physical Process Net-Maps
- Allows for a high level of participation (co-creation of Process Net-Maps during the interview)
Weaknesses:
- Time and resource-consuming (interviews can take between two and four hours, transcribing interview recordings and content analysis of transcripts is very time-consuming, too)
- Ideally, the interviewee has knowledge about the whole or at least most of the development process of the innovation (initiation, design, and implementation) which limits the number of possible interviewees
- Results are highly perception-based (this is not a dis-advantage per se, though, but needs to be made transparent)
Software and materials needed:
For conducting the Process Net-Map interviews the following materials are needed: Large sheets of paper, post-its in different colors and formats, color pens, material to build towers (e.g. small wooden bricks, stackable sweets), recording device, camera (to take a picture of the physical Process-Net-Maps in case some post-its do not stay in place when transported), batteries, interview guidelines, and participant consent forms.
For transcribing the interviews the software f4/f5 can be used. For content analysis of the transcripts software such as MAXQDA, ATLAS.ti, and NVivo is helpful.
Key references:
Contact info:
- Claudia Sattler: csattler@zalf.de
- Claas Meyer: claas.meyer@zalf.de
3.6 Qualitative comparative analysis
Author/s of method factsheet:
Claas Meyer
Short description of method:
Qualitative Comparative Analysis (QCA) is seen as middle way that combines certain features of qualitative research with features of quantitative research. QCA aims to find causal relationships between cases' properties (conditions) and an outcome, like success/non-success or similar. QCA is not following a statistical logic but employs set theory, Boolean logic (Yes/No, True/Untrue) or Fuzzy algebra (degrees of membership to Yes/No or True/Untrue within a range between 0 and 1). The method focuses on the understanding of the relations between different causes and their interconnections. The basic QCA idea is an application to intermediate sample sizes (between 5 to 100) that are too small for statistical analysis and a systematic cross-comparison while keeping a relation to the single case. The central principle is 'multiple conjunctural causation', which means that not only a single variable but combinations of variables can lead to an outcome, that different combinations of variables can produce the same outcome, and, that one condition can have different impacts on the outcome, depending on the combination with other factors. QCA allows for a determination of necessary and sufficient conditions for the outcome. It reveals that a condition can be interpreted as necessary if in the case that the outcome is present, the condition is always also present. On the other hand, a condition can be interpreted as sufficient in the case that if the condition is present, the outcome is always also present (see in particular Sehring et al. 2013; Schneider and Wagemann 2012; Rihoux 2003).
Application example: The Kindergarten case
Source: adapted from Berg-Schlosser and Cronqvist (2012: 138 et seqq.)
In a hypothetical case, the parents of a four-year-old boy are surprised about the desired guests for their son's birthday party. Thus, the example's outcome is a party invitation or non-invitation. The parents assume that reasons for invitation could be the membership in the son's Kindergarten-group (K-group), the age of the children (older kids preferred), and the gender.
They look at data of five invited and three non-invited children (see Table 4).
An example for a proposition from the table: Betty is a girl who is older than four and is not in the son's Kindergarten-group. Hence, individual conditions that are sufficient for the outcome 'Invited' are checked – meaning that wherever the condition occurs, the outcome should also occur. Neither all kids from the K-group nor all older kids (Age 1) are invited. Thus, the K-group and Age alone are not sufficient conditions. However, all girls (Gender 1) are invited to the party. Thus, gender is sufficient for the outcome. However, this does not fully answer the parents' question as in addition to the girls, the boy Adam is also invited. Therefore, combinations of conditions are applied: All kids older than 4 (Age 1) who are in the same Kindergarten-group (K-group 1) are also invited. The parents now can explain the invitation list of their son: Kids are invited when being a girl or an older kid from the son's Kindergarten-group.
| Conditions | Outcome | |||
|---|---|---|---|---|
| Names (cases) | K-group (yes: 1, no: 0) |
Age (>4 years: 1, ≤4 years: 0) |
Gender (girl: 1, boy: 0) |
Invited (yes: 1, no: 0) |
| Peter | 0 | 0 | 0 | 0 |
| Cindy | 0 | 0 | 1 | 1 |
| Ian | 0 | 1 | 0 | 0 |
| Betty | 0 | 1 | 1 | 1 |
| Michael | 1 | 0 | 0 | 0 |
| Paula | 1 | 0 | 1 | 1 |
| Adam | 1 | 1 | 0 | 1 |
| Jane | 1 | 1 | 1 | 1 |
Steps involved:
- Formulation of hypotheses relating certain properties (conditions) to an observed phenomenon (outcome) (problem definition)
- Case selection and gaining case knowledge (data collection)
- Selection of conditions and specification of the outcome
- Transformation of data into crisp or fuzzy sets
- Determination of similarities of cases with the same value of the outcome variable
- Complexity reduction: Many variables will be reduced to a few patterns
- Determination of necessary and sufficient condition(s)
- Examination of the inconsistencies (different combinations of conditions lead to the same outcome) and non-coverage (not all possible combinations of conditions are represented in the sample)
- Result interpretation and discussion
Results produced (examples):
QCA can show sufficient and/or necessary conditions (often combinations of different variables) for a certain outcome – for example combinations of certain design rules for agri-environmental measures (AEM) which are sufficient for the measure's success in terms of environmental effectiveness (see Meyer et al. 2015). Within the exemplary study it has been determined that (i) the targeting of one environmental goal; (ii) application to a certain area/ habitat; and (iii) an accessible advisory system, combined with (iv) either the possibility for flexible application or the obligatory participation of the nature protection agency in implementation may lead to AEM's environmental effectiveness.
How results can inform prototype development and assessment in InnoForESt:
- Identification of sufficient and necessary (framework) conditions for the implementation of governance innovations
- Identification of sufficient and necessary conditions for certain forest governance systems
Strengths and weaknesses of the method:
Weaknesses/challenges:
- Selection of cases and conditions: QCA faces challenges of studies with small case numbers – only a limited number of factors and conditions can be considered for valid findings
- Limited empirical diversity: 2n possible conditions need to be checked, but it will be hardly possible to find cases with all combinations
- Binary coding (csQCA): Crisp-set QCA makes it necessary to dichotomize all factors – the conditions have to be assessed as fully absent or present. Social and political phenomena may be too complex for such simplification
Strengths/benefits:
- Multiple and conjunctural causation: Necessary and sufficient conditions and their combination may better reflect social reality than statistical methods
- Better understanding of complex causal relationships among a larger number of cases
- Data summary: Putting all data into a truth table can make it easier to explore similarities, clusters, patterns, and differences among cases
- Testing existing theories and assumptions: QCA can be designed to falsify existing theories
- Testing new ideas, assumptions, and conjectures: QCA can be used in an exploratory way
Key references:
Contact info:
- Claas Meyer: claas.meyer@zalf.de
- Claudia Sattler: csattler@zalf.de
- Cheng Chen: chenchengvip@gmail.com
Furthermore, the COMPASSS network is recommended: COMPASSS (COMPArative Methods for Systematic cross-caSe analySis), a worldwide network for scholars and practitioners with interest in theoretical, methodological, and practical advancements in systematic comparative case research: http://www.compasss.org
3.7 Agent-based modelling
Author/s of method factsheet:
Francesco Orsi
Short description of method:
Agent-based modeling (ABM) is a class of computational models that simulate a complex system as a collection of agents interacting with each other and the environment according to some user-defined rules. With respect to other modeling or simulation techniques (e.g. system dynamics), which look at the system from above trying to describe its general features and eventually extrapolating the effects of the system on its components, ABM moves from the bottom up, trying to define the behavior of a system's constituent units (i.e. the agents) and letting broad patterns emerge from interactions of such units. While there is no formal definition of agents, they have some specific properties. They are autonomous, in that they can act independently; heterogeneous as they differ from each other in one or more characteristics; they can learn from the external world; they can interact with the environment and other agents; and they can move within the system. Depending on the field of application, agents can be anything from people to animals, from plants to vehicles, from firms to political parties. A key element of ABM is the concept of emergence, namely the system dynamics arising from the interactions of multiple agents. For example, the residential patterns we observe in cities (e.g. distribution of social and ethnic groups) do not simply depend on pure household preferences, but rather on the complex dynamic interactions that are induced by those preferences (Schelling 1971). This is what is often labelled as the idea that the overall system is more than the sum of its parts.
ABM is not a mathematical modeling technique, though mathematical equations can be used to simulate agents' decision-making (e.g. probability of choosing one path or another or one transport mode or another). Most actions in ABM are driven by conditional statements (i.e. 'if'-statements). Models aimed to simulate real-world contexts may be informed by behavioral information acquired through various kinds of surveys (e.g. stated preference) and can rely on data describing the spatial characteristics of the study area (e.g. GIS data). ABM supports a special kind of inductive scientific approach where the observation of individual behaviors allows the detection of pattern formation and eventually the formulation of theories, therefore aiding intuition (Axelrod 1997).
Steps involved:
The modeling cycle is a recursive process involving the following steps:
- Formulate the question
- Assemble the hypothesis about the processes and structures that are essential to the problem
- Choose model structure: definition of scale, entities, and state variables
- Implement the model: translation of a verbal model into an 'animated' object
- Analyze the model: learning from model outputs
- Start over…
Results produced (examples):
ABM can show the effects of individual decisions on the overall system and describe the consequences of a policy over time and across space, also highlighting which elements of a policy are likely to generate stronger or weaker impacts. In a study conducted in 2012-2014 to assess the effects of transportation management on visitation flows in a protected area of the Dolomites (Italy) (Orsi and Geneletti 2016), the use of ABM enabled the estimation of the effects of a transport mode's characteristics (e.g. frequency of travel) on the flows of hikers, the consideration of the impact of contingent traffic conditions (e.g. road congestion) on visitors' transport mode choice, and the identification of 'carrot and stick' policies that safeguard the environment without overly limiting visitor inflows.
How results can inform prototype development and assessment in InnoForESt:
- Identification of factors that may have a stronger impact on the success of an innovation (e.g. impact of harvest rate on sustainable forest management)
- Identification of actors that may have a stronger impact on the success of an innovation (e.g. impact of farmers' decisions and interactions on the extent of the forest over time)
Strengths and weaknesses of the method:
Strengths
- Ability to account for heterogeneity and interactions
- Ability to detect emergent phenomena
- Possibility to simulate systems that are too complex for mathematical modeling
- No mathematical literacy required
Weaknesses:
- Specificity of a model (scale, area, etc.)
- Difficult validation
- Computationally expensive: several simulation runs needed to account for stochasticity
- Difficulty of isolating the characteristics of agents
Software/Materials needed:
NetLogo (https://ccl.northwestern.edu/netlogo/) is a free open source software that requires relatively easy coding and can import GIS data. Other free packages are available, but they often imply a steeper learning curve. Commercial packages also exist.
Key references:
Contact info:
- Francesco Orsi: francesco.orsi@unitn.it
- Davide Geneletti: davide.geneletti@unitn.it
3.8 Feedback sheets
Author/s of method factsheet:
Claudia Sattler
Short description of method:
The main purpose of the feedback sheets introduced to InnoForESt by WP4 is twofold: Firstly, they serve the purpose to keep track of all activities and events conducted by the innovations teams in the different innovation regions and document also specific agreements made in conjunction with these activities and events. Secondly, they aim at stimulating the innovation teams to constantly reflect on their activities and employed methods and document what went really well and what did not to spur learning. In this way, reflexivity was meant to get instilled as a routine within the teams. Following Bryman (2016), reflexivity entails a sensitivity to one's own cultural, political, and social context and thus helps to narrow down what works under which conditions and why. As such, 'knowledge' generated from a reflexive position has always a reference to the person's location in time and social space (cf. Bryman 2016). Furthermore, documenting the 'nuts and bolts' of the inner workings of the innovation process can not only contribute to one's own understanding of the innovation process, but might also be useful for others (cf. Bryman 2016). It also sheds light on the sharing of responsibilities and the quality of the collaboration between the science and practice partners in InnoForESt, since documentation of activities also includes the specification of which actors were part of which activities.
Steps involved:
- Preparation of the template of the feedback sheet
- Distribution of the template to all innovation regions
- Continuous collection of filled-in feedback sheets and archiving
- Systematic analysis of feedback sheets for cross-comparison of innovation regions
Results produced (examples):
The feedback sheets filled-in by the innovation teams so far provide information on the following main aspects:
- Information on the event/activity in general: for example, date and time, location, produced materials such as agendas, minutes, slides, handouts, photos, etc. and if these materials were available to others (e.g. stored on the digital platform/intranet)
- An overview of the involved actors (e.g. participant lists)
- A short summary of the activity/event (in particular, what the objectives were and if they were achieved)
- A record of the agreements made and/or planned follow-up activities
- A reflection on how the event contributed to the innovation development process (What worked well? What didn't?)
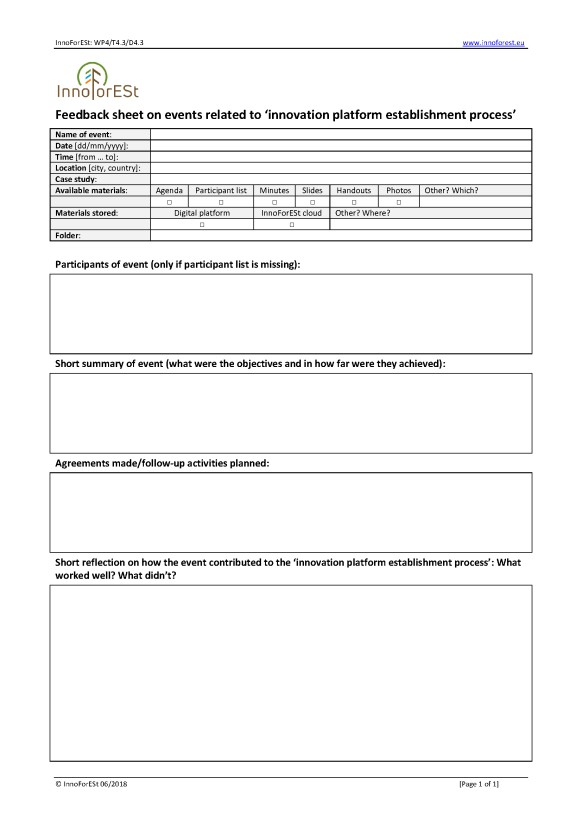
How results can inform prototype development and assessment in InnoForESt:
The information provided in the feedback sheets will form the basis for a systematic cross-comparison of the innovation regions to analyze the development pathways of the innovation processes over time and to look for similarities and differences. It also serves as a documentation of the experiences that were made with the different methods employed for prototyping. Furthermore, the feedback sheets can be used as a means to analyze the quality of the cooperation between the science and practice partners in InnoForESt.
Strengths and weaknesses of the method:
Strengths:
- Allows for keeping a full record of all activities and events conducted in connection with the innovation process in the innovation regions
- Serves as a tool to stimulate reflection within the innovation teams about conducted activities in the innovation regions
- Creates very rich data for cross-comparison of innovation regions
Weaknesses:
- To fill-in the feedback sheets is an extra effort for the innovation teams and draws additional resources
- If feedback sheets do not get filled-in shortly after activities/events were conducted important information might get lost which diminishes their value to support learning
Software and materials needed:
No specific software or materials are needed.
Key references:
Contact info:
- Claas Meyer: claas.meyer@zalf.de
- Manuel Asbach: manuel.asbach@zalf.de
- Claudia Sattler: csattler@zalf.de
3.9 Cross innovation region and work package Skype meetings
Author/s of method factsheet:
Claudia Sattler
Short description of method:
The cross innovation region and work package Skype meetings are one of the core means in WP4 to allow for regular exchange of knowledge and experience between all involved innovation teams in InnoForESt. They aim at supporting the exchange of knowledge and experience:
a) across different innovation regions and, thus, different regional and national contexts,
b) across different work packages and, thus, different scientific disciplines including both natural and social sciences, and, very importantly, also
c) across all innovation regions and work packages.
This is done by creating a space for informal dialogue between all teams for cross-fertilization and reflexive learning, also ensuring that information about the activities currently taking place in the individual innovation regions and work packages can be communicated between the teams for utmost transparency and to keep everyone on board about the progress of the project.
The Skype meetings are always structured in a similar way to allow for a common routine, providing equal space to both, innovation region and work package teams. However, there is also leeway to introduce special agenda points to allow for their more in-depth discussion. In the past, this concerned for instance the reports from the first CINA workshops conducted in the Finnish case study or a comprehensive presentation of the aims of the planned role board games in WP3.
The cross innovation region and work package Skype meetings are always prepared by WP4 with a Doodle to find a suitable date. Once the date is fixed an agenda is sent in advance to all participants with the option to comment on it. The invitation is then sent out about 2-3 weeks in advance together with the final agenda with one reminder sent about one week before the Skype meeting. In the agenda, the time is always indicated together with the time zone, to make participants located in different time zones alert to the fact that the local time can differ from the indicated time. The meetings are facilitated and moderated by the WP4 team, also setting up and initiating the Skype call. Afterwards, the meetings are followed-up with minutes distributed to all participants with the opportunity to make additions and corrections. Thereby, the responsibility to take minutes during the meetings is circulated among all participants to spread workload. The final version of the minutes is then sent out to all participants either together with the announcement of the next Doodle or the invitation after the date is fixed. In terms of time, the meetings are usually scheduled for a one hour time slot, but when additional points are introduced to the agenda the time slot can be increased up to one and a half or two hours (two hours are considered the maximum time one can really concentrate and listen).
A typical agenda contains the following points:
General aim:
- Give us an update on what is going on in the different innovation regions and work packages in regard to the innovation platforms
Agenda/Points for discussion:
- Routine (~ 5 min.): Minutes of the last Skype meeting ok for everyone? Who takes minutes this time? Are there more points to add for today's agenda?
- Update from innovation regions (~ 25 min.): Short update from each innovation region on activities related to the innovation platforms: Austria, Finland, Germany, Italy, Slovakia/Czech Republic, Sweden (for reasons of fairness, the sequence is changed each time, so it is not always the same innovation team that has to go last)
- Update from work packages (~ 25 min.): Short update from the six WPs on activities to support establishment of innovation platforms: WP6, WP5, WP4, WP3, WP2, and WP1 (same as above applies: for reasons of fairness, the sequence is changed each time, so it is not always the same work package team that has to report toward the end when time is running scarce)
- Organizational stuff (~5 min.): Next Skype meeting about when (an accurate date is found by setting up a Doodle each time)? Any special points for the agenda?
Up until now it worked fine to always include at least one or two members of each innovation region and work package team who could represent their innovation region or work package during the Skype meeting. However, team members who cannot participate, always have the chance to catch up on things through the provided minutes. The minutes also serve the purpose of documenting the agreements made during the meetings.
Steps involved:
- Set-up Doodle to find concrete date
- Compose agenda and invite feedback
- Invite participants once date is fixed and agenda is finalized, send final minutes of last Skype meeting attached to invitation
- Facilitate the technical launch and initiation of the Skype meeting (ensure stable internet connection, have all Skype-IDs handy, set-up a group call with all participants who have indicated their availability in the Doodle)
- Manage the moderation of the Skype meeting (keep track of time, organize speakers, see to it that all points in the agenda get equally addressed, keep discussions focused, allow for questions, handle discussions with multiple speakers, close meeting with specifying objectives for the next Skype meeting, and clarify the to-does for its preparation)
- Follow-up with minutes and invite feedback
- Start again with 1.
Results produced (examples):
The results of each cross innovation region and work package Skype meeting can be measured in the gain in knowledge of each participating team member on ongoing activities in all innovation regions supported by the activities in the individual work packages. The minutes are another formal output which summarizes the content of the conversations for those team members who could not participate in the meeting.
How results can inform prototype development and assessment in InnoForESt:
Through the regular exchange, the innovation teams can get inspiration for their innovation development from the other innovation regions and better know what kind of support they can receive from the respective work packages dedicated to help them in their efforts. Furthermore, work package teams can better align their activities to the activities conducted in the innovation regions for creating synergies.
Strengths and weaknesses of the method:
Strengths:
- Help to establish regular communication routines among team members
- Support in the exchange of knowledge across different innovation regions, across different work packages, as well as across innovation regions and work packages
Weaknesses:
- Preparation, regular facilitation, and follow-up activities are time consuming
- Depend on continuous commitment of all participants since only the regular exchange supports deeper knowledge exchange and keeps everyone informed about ongoing activities
- Since conducted with Skype, the quality of the conversation depends greatly on the internet connection of each participant, drop-outs due to loss of internet connection can happen
- Depending on the size of the team managing the conversation gets more demanding (for InnoForESt the team is quite large with about 14-17 participants included in the call on average)
Software and materials needed:
Online conference software is required, such as Skype or similar (e.g. GoToMeeting, GoogleHangout, Zoom, or other).
Key references:
Contact info:
- Claudia Sattler: csattler@zalf.de
3.10 Stakeholder interviews
Author/s of method factsheet:
Claudia Sattler, Caterina Gagliano and Ruggero Alberti
Short description of method:
Conducting interviews is one of the most popular data collection methods in social research (cf. Bryman 2016). The aim is to collect the data in a conversation-like situation between interviewer and interviewee. Typically, the interviewer asks questions to which the interviewee responds (one-way information transfer), but the information can also be transferred in both directions in a more open setting. In this case the interviewee does not only function as a provider of information, but is also encouraged to ask questions back and takes equal part in steering the conversation. In most interview situations, the constellation is one-to-one, but it is also possible to conduct interviews in a group setting with several interviewers, or interviewees, or both. Interviews are usually conducted in an oral format either face-to-face in person or via telephone or Skype (or any other audio- or video-conferencing software).
If interviews are conducted by phone or Skype this has the advantage that parties can be in separate geographic locations. However, direct personal interaction offers better opportunities for people to build rapport and form a connection. In most settings, an interview guideline is elaborated in preparation of the interview which lays outs important topics for the conversation and related questions, which are mostly asked as open-ended questions to spur the conversation.
In a structured and fully standardized interview, the questions are meant to get answered in a particular sequence, while in a semi-structured interviews, the interviewer has more freedom to jump between questions and also include new questions which arise during the interview. In this case, the guideline just helps to make sure important topics get addressed during the interview, but it is not important in which order. In unstructured interviews, the interviewer has complete freedom and asks questions spontaneously without a pre-defined guideline.
The less standardized the interview is the more difficult it is to compare interview results. In both semi-and unstructured interviews, additional topics that only come up during the interview can get addressed in a flexible manner. If possible, interviews are conducted in an environment familiar to the interviewee, where he or she feels most at ease and is not alienated by the situation so most authentic information can be obtained. Typically, the interviewer has some way of documenting the information that is gained from the interviewee, either by taking notes on paper or by recording the conversation, which gets later transcribed for more in-depth analysis.
Interviews can yield both qualitative and quantitative data. Depending on the number of topics addressed and questions asked, and the depth of the conversation aimed for, interviews can last between less than 30 minutes and several hours. Before an interview can be conducted, a participant consent form should be signed by the interviewee. The consent form specifies how data privacy issues are managed and how data are used and stored. If interviews touch upon very sensitive topics and ask for very private information, typically also approval from an ethic commission is necessary before the interviews can be conducted.
Table 5 below provides an overview of the different possible interview types.
| Possible types of interviews | Relates to … | Remarks |
|---|---|---|
| Investigative vs. mediating | Main purpose of the interview | One-way flow of information vs. two-way flow of information |
| Individual vs. group setting | Number of interviewees | More conversation vs. more group-discussion like situation |
| Oral vs. written | Form of communication | Direct oral conversation or written conversation (e.g. by e-mail) which gives interviewee more opportunity to think about the answers |
| Face-to-face vs. telephone | Medium of communication | Exchange by means of language, facial expression and gestures vs. only by language |
| Closed vs. open | Degree of freedom for interviewee | Portion of closed vs. open-ended questions where interviewee is encouraged to elaborate |
| Structured vs. unstructured | Degree of freedom for interviewer | Strictly following the guidelines vs. allowing for extra topics and questions to emerge |
| Quantitative vs. qualitative | Analysis of the interview | Balance between quantitative analysis (e.g. number of positive and negative viewpoints towards a specific issue) vs. qualitative analysis (e.g. interpretation of interview data in regard to how certain viewpoints were influenced by interviewee's values and beliefs). |
Steps involved:
Below is a list of steps necessary for the preparation, conducting, and analysis of face-to-face stakeholder interviews:
- Preparation:
- Formulate general topic/s and related research question/s
- Develop research design and elaborate interview guideline
- Pre-test interview guideline and adjust if necessary
- Contact possible interviewees and schedule interviews
- Finalize interview schedule and figure out travel logistics
- Conducting:
- Explain the purpose of the interview to interviewee and assure anonymity/data privacy
- Answer to all questions the interviewees has
- Obtain consent to participate (signature on participant consent form)
- Start audio-recording (provided the interviewee has agreed)
- Opening/icebreaker question
- Address questions related to each topic of interest (in prepared or loose order), if applicable allow for new questions which arise during the interview
- Concluding question to signal end of interview
- Stop audio-recording and wrap up, for example, inform about how obtained data are further processed and how results are presented and shared
- Analysis
- Transcribe interview recordings, where applicable with suitable software (e.g. f4/f5)
- Analyze data qualitatively, and, if applicable, also quantitatively, where applicable with a suitable software (e.g. MAXQDA, ATLAS.ti, NVivo)
- Share results with interviewees and invite their feedback
Results produced (examples):
Interviews are employed as a method to collect interviewees' individual knowledge, viewpoints or perceptions on a certain topic of interest. In InnoForESt, interviews were conducted in all innovation regions, in particular in the context of the stakeholder analysis (SA) and the governance system assessment (GSA), to explore different aspects of the developed innovations.
However, one example where interviews were applied in a very special format is the Italian innovation region. Here, 'on the job' interviews were conducted with the interviewees during their daily work routines (e.g. forestry firms operating in the forest). This setting has a number of advantages over static interviews. One advantage is that it reduces the time load and effort for the stakeholders to participate in the interviews. Another important advantage is that it helps the interviewees to connect their answers immediately to their experiences in everyday live. A similar concept was applied by Clark and Emmel (2010) who conducted 'walking' interviews, which were conducted while people were taking a walk through their neighborhood and closer living environments.
For more details on the experience with the 'on the job' interviews conducted in the Italian innovation region please see section 5.
How results can inform prototype development and assessment in InnoForESt:
Interviews allow for the collection of data on a wide range of different aspects of the innovation prototypes:
- How current innovations emerged and evolved over time in the past
- Which strengths and weaknesses, opportunities, and risks are associated with the innovations from the viewpoint of different stakeholder groups
- How current innovations could be further refined through strategies for upgrading and/or upscaling in the same or another innovation region
Strengths and weaknesses of the method:
Strengths:
- Very flexible method which can be adapted for diverse context settings (e.g. individual vs. group interviews, conducted inside vs. outside)
- Yield very rich data which can be analyzed qualitatively and quantitatively
- Can be conducted in the familiar environment of the interviewees
- Can be combined with other methods (e.g. quantitative surveys, focus groups) for method triangulation
Weaknesses:
- Transcription and analysis of data is very time-consuming (one hour of interview takes five to six hours to transcribe on average)
- Audio-recording can have a very poor quality when interview was conducted in an environment with a lot of background noise
- Audio-recording can make people too self-conscious which can impact on the quality of the answers
Software and materials needed:
- High quality recording device (e.g. devices from Yamaha, BriReTec, Tensafee, or similar)
- Software for internet-based telephone interviews (e.g. Skype, FaceTime, or other)
- Software for transcribing interviews (e.g. f4/f5)
- Software for analyzing interview data (e.g. MAXQDA, ATLAS.ti, NVivo)
Key references:
Contact info:
- Claudia Sattler: csattler@zalf.de
- Caterina Gagliano: caterina.gagliano@provincia.tn.it
- Ruggero Alberti: ruggero.alberti@provincia.tn.it
3.11 Focus groups
Author/s of method factsheet:
Claudia Sattler
Short description of method:
Essentially, focus groups are a group interview with several participants enabled by a moderator or facilitator (cf. Bryman 2016). They typically emphasize a specific topic which is explored in-depth based on individual inputs from the different participants. Focus groups aim to offer an unstructured setting for the extraction of participants' viewpoints and perspectives. One important element is that participants have the opportunity to respond to each other's views (unlike individual interviews where viewpoint and opinions are collected separately one by one). Thereby, the interaction within the group allows for the mutual construction of meaning and examining the ways in which people interpret the chosen topic together, while probing each other's reasons for holding a certain view. In consequence, listening to other participants' viewpoints can often lead to the modification of one's own viewpoint.
Focus group participants can represent natural groups, who already exist and cooperate in real life, but can also constitute artificial groups of individuals previously unknown to each other based on carefully defined stratifying criteria (e.g. age, gender, professional occupations, and certain group memberships). In view of InnoForESt, an example for the first could be a group of forest managers representing one single category of stakeholders who collaborate with each other on a regular basis. And an example for the latter could be a focus group which brings together different categories of stakeholders (e.g. forest managers, forest owners, and policy makers concerned with deciding and implementing forest-related policies) who did not interact with each other before. An advantage of artificial over natural groups is that people who do not know each other are less likely to operate with taken for granted assumptions, but will question each other's viewpoint more thoroughly.
The group size usually ranges between eight to fifteen participants, with a recommended group size between six and ten. The number of conducted focus groups per topic depends on the purpose of the study. The aim of conducting several focus groups is to establish whether there is any systematic variation in the ways in which different groups with particular attributes discuss a certain topic. Often, the number of conducted focus groups follows the saturation criterion, where groups are conducted until provided perspectives and observed pattern begin to repeat.
The moderator/facilitator should not be too intrusive and structured, but rather support by guiding the focus group through general questions to stimulate the discussion and allow all participants to articulate their viewpoints (cf. Bryman 2016). However, asking the same general question(s) for each group in a series is important to ensure comparability between groups. In this vein, the moderator/facilitator should keep interventions to a minimum and only give input when the group is struggling in the discussion. However, if participants stray too far away from the core topic(s) it might be necessary to refocus the discussion. The moderator/facilitator should also avoid showing agreement or disagreement with expressed personal opinions to remain impartial. In addition, caution is needed regarding body language (e.g. frowning, fidgeting, or shaking one's head). It is also the role of the moderator/facilitator to ensure equal participation and restrict participants who show a tendency toward monopolizing the discussion.
Steps involved:
- Planning:
- Select the participants and the moderator/facilitator
- Define the aims and one or two general questions per core topic to initiate the discussion
- When appropriate, prepare an ice-breaker for the beginning of the session to make participants feel at ease
- Implementation:
- Lay out the aims of the focus groups once again
- Provide details on the format of the focus groups (e.g. planned time frame, how session is followed-up)
- Obtain permission for the way recording/documentation of session is planned
- Introduce conventions and general rules (e.g. everyone's views are important, only one person speaks at a time)
- Start discussion, for example, with ice-breaker and prepared questions
- Closing and follow-up:
- Thank everyone for the participation
- Elaborate on what happens to the data and how they will get informed about the results
- Announce any planned follow-up events
Results produced (examples):
Focus groups typically yield very rich qualitative data which are audio-recorded during the sessions (cf. Bryman 2016). They get transcribed afterwards and the transcripts are analyzed through qualitative content analysis afterwards, based on a system of codes and sub-codes addressing topics of interest for the analysis. Of particular importance for the analysis are usually the different viewpoints and perspectives expressed by the different participants toward the explored topics and how initial viewpoints changed during the discussion and what types of compromises and agreements could be reached.
How results can inform prototype development and assessment in InnoForESt:
- Explore stakeholders' viewpoints and perspectives on the current strengths and weaknesses of an existing innovation
- Explore stakeholders' viewpoints and perspectives on several alternative prototypes of an innovation
Strengths & weaknesses of the method:
Strengths
- Offers opportunity for participants to think about the reasons why they hold the view that they do and express the reasons to the others
- Due to the possibility to question each other's viewpoints, participants end up with a more realistic account of the different aspects of a discussed topic
- Allows for studying the ways in which individuals collectively explore and make sense of a topic and construct meaning around it
- Yields very rich data for the analysis
Weaknesses
- The documentation is way more difficult compared to individual interviews, as it is harder to keep track of who says what in the recordings
- Transcribing the recording is more complicated and challenging and is best be done by someone who was present (1 hours can take up to 8 hours transcribing time)
- The amount of data to be analyzed can be very large
- Often requires over-recruitment, because some invited participants do not turn up
- Dealing with overly prominent speakers and encouraging shy ones can be difficult
- Group effects can occur, i.e. an emerging 'group view' held by the majority can question views held by single individuals which are perfectly legitimate
- Focus groups might not be an appropriate method for very sensitive topics, if sharp hierarchies exist among participants, or when it can be expected that participants disagree profoundly on the topic
Alternatives to face-to-face focus groups: online focus groups
As an alternative option to face-to-face focus groups, online focus groups can be conducted. These can be held either synchronously (everyone participates in real time at once) or asynchronously (participants get the questions per e-mail and type their responses into the conferencing software readable to all other participants, but participate at different times over a longer period). For online focus groups conferencing software is required.
Online focus groups have the advantage that they can be conducted with participants located in different geographic locations and time zones at relatively low costs. This is of great benefit if participants are from very remote areas as no traveling effort is needed. Also, there is no need to transcribe the sessions since contributions are already typed. Because responses are typed, typically statements are more articulated. Another advantage is that the identities of the participants can be concealed which also allows to discuss potentially very sensitive topics. Further, communication might be easier for shy people, since overbearing participants are less likely to dominate.
However, the risk of drop outs is greater when the online connection is lost. Also participants cannot capitalize on body language, since in face-to-face settings it is easier to establish rapport and probe participants. For synchronous online focus groups moderation can be quite difficult and is not advised for more than a maximum of six to eight participants. For asynchronous online focus groups larger groups are possible, but with the disadvantage that the moderator cannot intervene.
Software and materials needed:
A high quality recording device and good microphone is required for the recording of the sessions. For the analysis of the transcripts software packages such as MAXQDA or ATLAS.ti can be useful. For conducting online focus groups conferencing software such as FocusGroupIt or QDC Studio are available.
Key references:
Contact info:
- Claudia Sattler: csattler@zalf.de
- Christian Schleyer: christian.schleyer@uibk.ac.at
3.12 Stakeholder analysis
Author/s of method factsheet:
Christian Schleyer, Peter Stegmaier, Jutta Kister, Michael Klingler, Ewert Aukes
Short description of method:
In InnoForESt, stakeholder analysis serves as an empirical and analytical tool helping to identify, map, and integrate a diversity of stakeholders' interests, visions, and concerns in the context of both the governance innovations pursued in the innovation regions and the innovation platforms to be established.
The term 'stakeholder' can have several meanings, including notions of participant, involved party, targeted group, partner, intermediary, opponent and, more broadly, actor. There is an on-going debate on the definition of stakeholder, 'in part due to the problem of defining what constitutes a legitimate stake' (Reed et al. 2009). However, most definitions have 'in common that they refer to any person or group who influences or is influenced by the process or result of any kind of project or decision' (Hauck et al. 2013). In InnoForESt, stakeholders include any group (e.g. organized civil society actors) or individual (e.g. citizen) who – actually or potentially – can affect or is/are affected by the governance innovation targeted in a respective innovation region at the various levels and in the different realms.
Stakeholders are situated in a dynamic system of interdependent relationships deeply rooted in the local situations and based on roles, resources, expectations, and influence, thus forming a 'network of mutual dependency' (Zimmermann and Maennling 2007). Since they have different kinds of resources and relationships as well as different objectives their actual or potential influence and involvement in the governance innovation process varies substantially. Similarly, they are affected by the results of those innovation processes, the scenarios discussed, the prototypes further pursued, etc. in different ways.
The methods for stakeholder analysis used in InnoForESt have the following aims:
First, to create a broad and rather comprehensive list of stakeholders and stakeholder types, who are potentially relevant for fostering or hampering the governance innovation process in the innovation regions. This does not mean that all stakeholder types are likely to be relevant in each innovation region and, thus, would need to be analyzed in depth. Further, it does also not mean that all stakeholder types are consider themselves being important and/or are likely to become involved in the innovation. Rather, it can be seen as a 'check list' that the innovation teams can use to decide which stakeholders or stakeholder groups might be relevant and thus would need to be considered. At the same time, this list can be complemented by stakeholders not yet featured in the list, but with potentially high relevance and weight for the respective governance innovation.
Second, to provide an extensive overview of analytic categories to be covered by the empirical analysis, i.e., the potentially relevant stakeholder characteristics (e.g., interests/motivations, actual/potential influence, knowledge, competencies, educational background, available power and other resources, visions, and concerns). These categories help to design, for example, semi-structured interview guidelines.
Third, to suggest a diverse set of empirical approaches, from which the innovation teams can choose when planning the stakeholder analysis. They include identifying and analyzing relevant published research, legal documents, planning materials, policy documents, and other written sources. Particularly fruitful are further, exploratory (open) and/or semi-structured interviews with (key/all relevant) actors, either face-to-face or telephone as well as focus group discussions or other kinds of workshops or meetings with practice partners, and surveys. Which (combination of) method(s) to choose depends to a large extent on the time and personnel available for undertaking the analysis, the intended degree of detail and desired comprehensiveness of the results, the availability and quality of relevant previous stakeholder analyses, and the complexity of the stakeholder context.
Steps involved:
- Compiling a preliminary list of (potentially) relevant stakeholders and stakeholder types and (potentially) relevant stakeholder characteristics using the knowledge of the practice partners and other experts involved
- Identifying and assessing relevant published research, legal documents, planning materials, policy documents, and other written sources like reports of previous projects, documentations of networks and business clusters, and identifying knowledge gaps
- Deciding on (a combination of) empirical approaches to mitigate the knowledge gaps and on conducting and analyzing those approaches
- Compiling and structuring the results according to the knowledge needs and specific purpose of the stakeholder analysis
- Checking if knowledge gaps are sufficiently 'filled', if not, initiating further empirical phase (e.g. interviewing more/other (types) of stakeholders, adding new empirical approaches (e.g. initiating a focus group, carrying out social network analysis/Net-Maps)
Results produced (examples):
Results can take very different forms depending, among other, on the comprehensiveness and extent of the information gathered and the specific purposes of the stakeholder analysis. They can take the form of text descriptions (narratives), tables, graphs or maps (please see Figure 10 for an example).

How results can inform prototype development and assessment in InnoForESt:
The results can ensure the appropriate representation of relevant (types of) stakeholders (1) during the establishment or creation of the innovation networks and their goal-oriented, target expansion (taking place in CINA workshops and beyond), (2) in the scenario development and the experiments with prototypes, and (3) in the prototype assessments (e.g. via CINA workshops). It also provides essential information on stakeholder constellations, characteristics, interests – perhaps even detrimental to the governance innovation discussed –, visions, concerns, and previous experiences that need to be taken into account when planning the prototyping strategies (up-grading, up-scaling, and/or replication).
Strengths and weaknesses of the method:
Strengths:
- It prevents arbitrary selection of participants for CINA workshops.
- It allows identifying the different discourses used by stakeholders to address the issues and problems they perceive and their arguments related to forest-related governance issues. It also accounts of the stakeholders' perception of the direction and usefulness of governance innovation (processes), as well as their possible contribution and their expectations.
- It helps in identifying the 'chronic absentees' or stakeholders that are 'hard to reach' and, by assessing their characteristics and interests, ways can be found to motivate them to join the innovation platform and/or take part in the CINA workshops.
- It contributes to the representativeness of stakeholders involved in the governance innovation process.
- It avoids to mobilize always the same participants (the 'habitués'), the network of usual suspects', namely people who have been involved in previous projects or are generally interested in participatory and civic engagement processes – but by no means represent all or even the most relevant stakeholder groups (Lang et al. 2012).
- It gives less chance for a feeling of exclusion (and consequent problems of mistrust). Stakeholder analysis can help providing transparency on how and when stakeholders can become involved (Maguire et al. 2012).
- It is possible to identify also the 'manipulative' stakeholders, which – in group settings – tend to speak a lot without listening and to catch the full attention without leaving space to the others and to prepare strategies to 'manage' them in advance.
- It gives a better understanding of involved stakeholders, contributing to a better design of the platform and of the CINA workshops. Thus, it is possible to keep the InnoForESt innovation actions as compatible as possible with stakeholders' perspectives, interests, visions, and concerns maximizing the benefits of stakeholder engagement and avoiding stakeholders' fatigue.
- It is flexible in terms of analytical focus, and time and resources needed to carry it out.
- A broad range of empirical methods can be used/are available
- No extensive training is needed.
Weaknesses:
- Using pre-defined stakeholder categories and characteristics may reduce the likelihood to find/explore other stakeholder (types) and characteristics.
- Assessing (only) a restricted number of stakeholders may result in an unwanted selection bias.
- Although the method neither prescribes a concrete number of stakeholders to be analyzed, nor the level of detail on which to explore stakeholder characteristics, nor the empirical approach for collecting the stakeholder-relevant information, the sheer range of potential stakeholders and their characteristics potentially worthwhile to investigate may be perceived as overwhelming by the innovation teams.
- Time and other resources may be critical on part of the innovation teams. Experiences with some of the empirical methods suggested may be limited.
- Even a carefully and properly conducted stakeholder analysis will only be able to capture the status quo. With the governance innovation process progressing, stakeholder constellations may change, as may the vested, specific interests of stakeholders involved in the process. Thus, procedures would need to be defined for updating and/or expanding the stakeholder analysis to account for the changes in context or focus of the respective governance innovation (process).
Software and materials needed:
Audio-visual documentation of interviews or focus groups using respective recording devices is certainly helpful, but not essential. Flipchart paper, moderation cards, and similar material would be of advantage. Further, for analyzing transcripts of interviews or similar sources text analysis software like ATLAS.ti or MaxQDA facilitates the analysis, not the least since it allows for a flexible, yet structured categorization and coding and, thus, can enable in-depth text analysis. To visualize and analyse the stakeholder networks, software-based tools as VennMaker (www.vennmaker.com) or Gephi (https://gephi.org) are useful.
Key references:
Contact info:
- Christian Schleyer: christian.schleyer@uibk.ac.at
- Peter Stegmaier: p.stegmaier@utwente.nl
- Jutta Kister: jutta.kister@uibk.ac.at
- Michael Klingler: michael.klingler@uibk.ac.at
3.13 Use of social media
Author/s of method factsheet:
Daniel Monteleone
Short description of method:
By using social media, organizations or projects such as InnoForESt are able to communicate more directly and more personally than through many other forms of dissemination. Individuals interested in the project can message project partners directly through Facebook, or ask questions on Twitter, or watch videos on YouTube and comment below them. These methods are upgrades over more traditional means for dissemination such as through scholarly papers or mass media (e.g. television, newspapers), which are usually only one-sided in their dissemination tailored to a specific clientele (e.g. the scientific community).
Steps involved:
The steps involved in the use of social media are different, due to the changing nature of social media, and partially due to the different goals of each organization or project trying to get their message across. Here, we will discuss a few of the most widely cited or reviewed methods.
Culnan et al. (2010) suggest a very simple three-step procedure: First, to make a 'mindful decision' regarding the initial adoption. Second, to build 'communities', because social media are essentially communication systems, And, third, to develop an 'absorptive capacity' in order to learn from the content their customers generate." Even more simply put this sums up to: plan, build, and learn.
Another viewpoint was presented by social media expert company Search Engine Watch (www.searchenginewatch.com) which noted three parallel approaches could be 'many-to-many, one-to-many, and one-to-one.' The first consists of many persons providing information to many by disseminating the information widely, for example, through mass e-mailing. The next approach consists of one person providing information to many, such as providing a YouTube video or a Moodle web-seminar. Finally, the third approach consists of one person providing tailored information to another person who is interested in a particular question or issue addressed by the project.
Still another set of steps comes from Kietzmann et al. (2011): They suggest using an interconnected honeycomb of building blocks, which include 'identity, conversations, sharing, presence, relationships, reputation, and groups'. According to Kietzman et al. (2011), all these building blocks are linked to each other, setting the framework apart from other authors, who rather suggest sequential steps.
The suggestions made by the authors presented above just represent a few of the guidelines that can be used to help provide a step-by-step instruction for successful use of social media.
Results produced (examples):
Thanks to the technological nature of social media, it is quite easy to measure many of the outcomes of social media dissemination. Google Analytics, for instance, one of the most widely used analytical measurement tools on the internet, has a plethora of ways to see how a specific website is doing. For instance, it can record the amount of time a user stays on a webpage, and based on the users' IP addresses also retrieve the information where the user comes from, and even what operating systems their devices are using to view the pages. So it is worth considering for a project if it likes to make use of this service, provided data protection issues are well considered. As another example, Twitter Analytics can record the number of re-tweets, likes, and even just views of individual tweets.
To give an idea what difference the use of social media can make, we include the example of the Grammy Awards in the United States between 2009 and 2010. Although the Grammy's had been increasing in popularity back then, it had rather low viewership amongst the prime marketing audience, 18-49 year olds. By using a multi-faceted social media plan, they were able to increase their audience in the 18-49 year old bracket by an astounding 31% in 2010. This is just one of many success stories of organizations and projects recognizing the importance of social media, and today it is understood that social media is vital for any project in the present day.
How results can inform prototype development and assessment in InnoForESt:
In order to make social media content regarding the prototypes appealing to a wider audience, innovation teams could use a story format to present their region and innovations. Thereby try to emphasize both the uniqueness of their approach to raise interest, but also how it could be used by other regions. It is also recommended to include lots of visual materials since they increase the likelihood of views, likes, and re-tweets. Equally important is tailoring content toward the target groups: For instance, in the case of the Swedish innovation 'Love the Forest', since it is aimed at children, the social media push would likely be more focused on fun aspects. By contrast, the value chain approach in Austria is addressed at adults, who (though also wanting to be entertained) will be likely more interested in numbers, profit, value, and the economic side of things.
In addition, it would be very helpful to identify and track key performance indicators. For instance, by using Google Analytics and/or Twitter Analytics on a regular basis, InnoForESt would be able to review what is working and what is not for the project. If we notice very few page views, then it is clear that dissemination methods need to be improved. Seeing where the audience is coming from might also help us to better plan what sort of material would be best provided. If we recognize that current dissemination efforts are not working as well as hoped, we need to find different methods of growing the audience.
Strengths and weaknesses of the method:
Strengths:
- increased traffic to your website
- improved ranking on search engines
- opportunity to invite public engagement and feedback from interested users/followers
- improved networking opportunities
Weaknesses:
- additional resources are needed to appropriately manage the project's online presence on social media (since social media is immediate it needs daily monitoring)
- greater exposure online has the potential to attract risks, which can include information leaks or hacks
Software and materials needed:
Social media includes for instance Facebook, Twitter, YouTube, Instagram, WhatsApp, LinkedIn, ResearchGate and other, with Facebook and Twitter being the most widely referenced. No special software is required since all are web-based formats where only an account has to be set-up. At present, InnoForESt makes use of Facebook and Twitter.
Key references:
Contact info:
- Daniel Monteleone: daniel.monteleone@elo.org
- Lindsey Chubb: lindsey.chubb@elo.org
3.14 Video production
Author/s of method factsheet:
Lindsey Chubb, with contributions from Carol Grossmann
Short description of product, aim and method:
Seven short project videos (six to seven minutes long) were produced: six to showcase the different innovation regions of InnoForESt, and one to introduce the overall concept of InnoForESt and highlight the innovative endeavors for the provision, use, and management of forest ecosystem services in general. The videos are aimed for a) encouraging broader participation of other practitioners and beneficiaries of forest ecosystem services, and b) for contributing to an increased sense of ownership among the project partners involved. They were conceptualized as filmed interview sequences and produced by (semi-)professional filmmakers in close cooperation with different project partners, depending on each video's focus.
The videos can be useful for optimizing public relations activities, promoting project initiatives, engaging stakeholders, reaching local communities as well as for training and educating other partners and interested individuals. While creating quality videos is important, if they are not seen by the target audience, for all intents and purposes, they do not exist. So choosing the right method to disseminate the videos, therefore, is also of utmost importance for achieving impact.
Steps involved:
We differentiate 13 steps in the production of the videos. These include everything from preparing the outline and script, selecting interviewees, setting up the equipment and choosing the setting, recording, collection of topic-related or site-specific pictures and other visual material, composing texts for headlines and editing (with comments from other contributing partners), communicating with the editing team (a full-service webcasting company specialized in video production), finalizing edits with comments, payment, and incorporation onto the website (may require IT experience to fit larger files).
For producing a video you can follow this guideline step-by-step:
- Outline: Determine and summarize the objectives for the video production, including the main message and target group. Knowing the objectives will guide you to pick the right style of the video (see step 2). For the format of an 'informative interview video', as done for InnoForESt, the main message will lead to the interview questions you create as well as help determine who the best person is to answer them (see steps 3 and 4). An outline of the video's intentions will also be helpful for the invited interviewee/s (see step 8), so they can feel confident that they know the direction of the video and what questions they can expect so they can prepare some answers, as well as for the editors of the video at the end of the production process (see step 12).
- Pick a creative style: Is this video intended for dramatic effect to demonstrate a serious societal issue or is it lighter and more sympathetic? There are many kinds of videos for showcasing your innovation region, demonstrate certain activities, interview important stakeholders, or promote your innovation. For InnoForESt, we recommend an interview-sequence with underlying topic- or site-related moving pictures.
- Research and Preparation: Prepare the script and determine who will be the interviewer and the interviewee/s. Therefore, consider who is an expert on this topic, and, who feels most comfortable speaking about it. Sometimes the most experienced person in this field is the best person to interview, but not always. Also local people who have a close connection to the region and who are able to speak local and non-technical jargon, can bring a personal touch that creates a connection between the audience and the video message. Invite interviewees and be prepared to receive rejections or difficult scheduling.
- Create questions: The questions can be very simple depending on what the objectives of the video are. For a general project video, questions that ask what the project is about, for explanations of key terms that audience members outside the field might not fully understand (e.g. forest ecosystem services, governance approaches) and what the interviewee's contribution to the project is (e.g. in the case of InnoForESt, many were scientific or practice partners who contributed differently toward the further development of the innovations). Consider what is unique about each region or innovation and highlight the originality.
- Determine location and setting: Choose an environment that is visually appealing and quiet and has a good lighting balance between the background and the person in the shot and avoid backlighting. Digital screens or windows in the background are sometimes significantly brighter than the person in the shot and this can be difficult to edit and fix later. In the case of InnoForESt, the Trento scenery in the background outside demonstrates the beauty of forests, but the lighting on the interviewees was a bit dark and had to be fixed in the video editing later. Posters which are large and more focused on visual aids and diagrams than text can also be useful as a background setting. Outdoor interviews may be visually attractive, but need special attention to the quality of sound recording and background noises.
- Ensure you have all the necessary materials to record: Video camera, battery, memory cards, two microphones, tripod, and spotlight are needed as equipment. If possible, pack extra camera batteries and memory cards. Spare batteries and large memory cards (64 gigabyte, at least) are necessary in case batteries die during recording or memory cards fill up storage space. Often a tripod is needed for one fixed camera to keep it steady and in a good position for the height of your interviewee and background. Determine if you are using single-camera or multi-camera shots. One fixed camera will fulfill the purpose, but more than one camera can provide additional footage and different angles which can later be edited together for a more dynamic feel. Use two different microphones for the interviewer and the interviewee. In general, the camera microphone is not strong enough to give a balanced recording of both interview partners. If you have access to a professional sound operator, designate one person to be solely responsible for recording and monitoring the audio to prevent poor audio quality. If this is not in the budget, do a test run of the audio and play it back before conducting the entire interview.
- Determine the eye-line: Interviewees tend to look at the person who is interviewing them, if you are off to the side of the camera, this is what you will see in the resulting video. However, this can seem odd to the person who is later watching the video. So, select your placement wisely: typically it is better for the interviewer to be behind the camera.
- Communicate with the interviewee before you record: Inform the interviewee of what you plan to do with the results of the video. They may have questions or suggestions that could be useful for the video production that you have not thought of before. Then, inform them about the general chronology of the interview, start a direct conversation with them to open the dialogue, and to get them comfortable before recording.
- Control the pace of the conversation: Ask the interviewee to avoid responding immediately to the question, but instead take a small pause before answering. This can be helpful, if you like to take out certain audio sequences later on (such as the interviewer's voice), as this can be very difficult otherwise.
- Record the interview: Record the interview sequences. If something goes wrong (e.g. someone interrupted during the recording and additional voices get caught on the recording), this is not dramatic. Just re-record the sequence once again.
- Collect relevant high-resolution images: To make the video more diverse and visually appealing, include logos, additional photos, or already existing film sequences. They make the video more attractive and can support you in conveying the messages of the video.
- Edit video: A professional video production team that is hired will have all the necessary video editing software and materials for special effects (e.g. adding music, text and subtitles, and image effects). Otherwise, these have to be done by you, but then often the quality is not as high as if it is done by a professional. However, it is still possible to make a nice video with inexpensive and simpler video products. Services such as Clipchamp (www.clipchamp.com), for instance, allow for obtaining free online music and stock images. A few rounds of editing and comments between the editing team and contributing project partners will be necessary for additional feedback and suggestions to help the video achieve its objectives, but it is also to ensure mistakes are avoided that the video editing team would not recognize such as misspelled names or incorrect logos.
- Share the video on your selected platform: The file size of the video will determine the ease of uploading it to different platforms. Higher quality videos are often very large and will be limited to fewer platforms if a professional IT technician is not included in the process. Their assistance will be necessary when uploading the video to the project website. As a popular social media network, YouTube is also a great starting point for video dissemination. It will give you a link which you can post on other mediums and it also has its own analytics. The video can then be shared on social media platforms such as Twitter, Facebook, Instagram, or LinkedIn. For the best results, post the video on a weekday, statistically a Thursday between 14-16h is the peak video viewing time!
Results produced (examples):
For InnoForESt, altogether seven videos were produced: one general project video (www.innoforest.eu) that explains the project with the inclusion of all participating partners and six individual videos for each innovation region (see Figure 11).
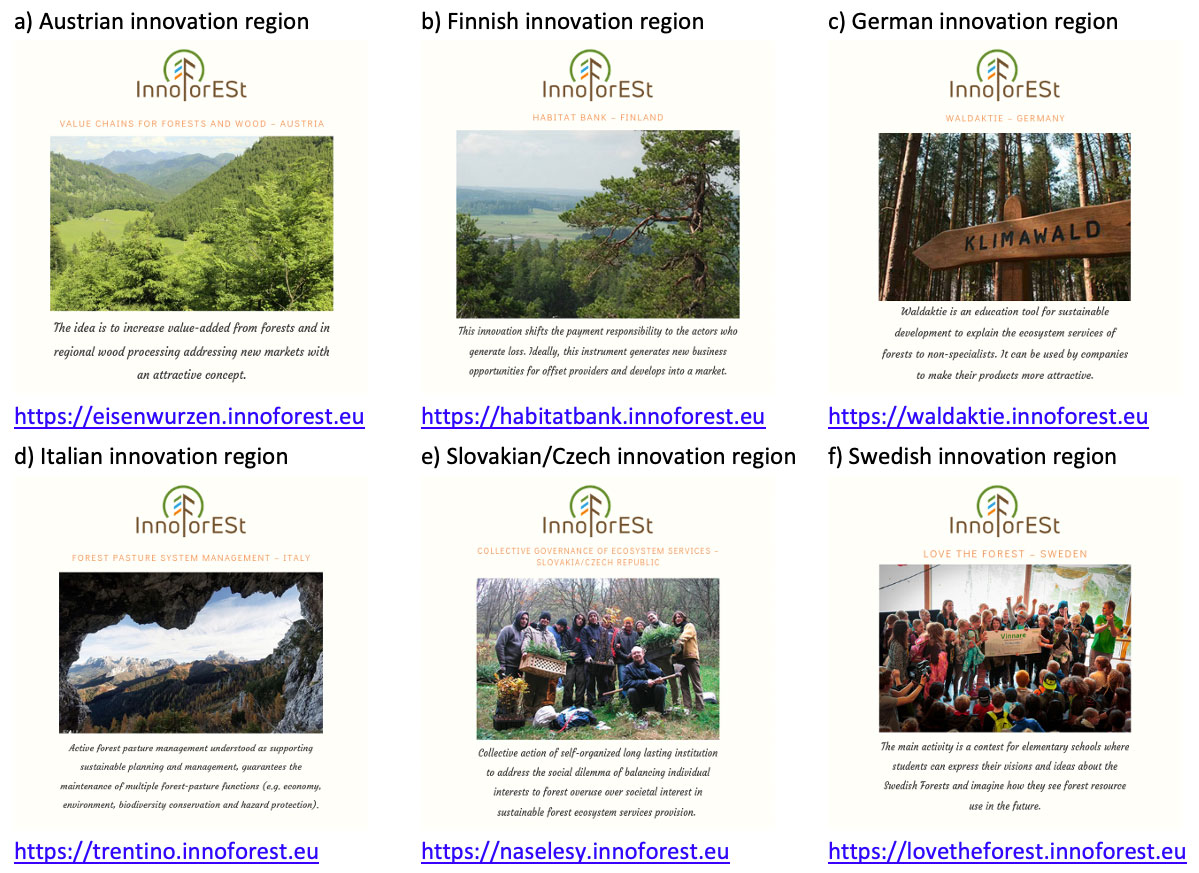
How results can inform prototype development and assessment in InnoForESt:
Sharing a project overview and information about the different innovation regions will allow interested parties to get an idea about the different innovations and how they are planned to get further developed. This might also trigger interest to copy the presented approaches, which seems of particular importance for the prototype strategy of replication.
Thereby, images and examples taken from each innovation region can help draw in the audience to the region and bring a more personal touch. It feels more genuine to see how the innovation impacts the people of a region with regard to jobs or improving their environment through the services provided in their region. It is also useful to see how the innovation helps the innovation regions achieve their objectives. This can inspire other regions to ponder what that could potentially mean for them if they adopt the innovation for their region.
Through the use of analytical methods (e.g. Google Analytics) one can also get an overview of how many people approximately have seen the video on the website, or other social media platforms such as YouTube, Twitter, or Facebook.
Strengths and weaknesses of the method:
Strengths:
- Videos show non-verbal and verbal communication: Relying on text alone, for example in articles or blogs, to convey a message requires careful word choice while non-verbal communication (i.e. appearance, facial expression, body language, gestures and eye contact) and verbal communication (i.e. volume, speed, intonation, articulation and enunciation) can communicate the message with a bit more ease and less consideration.
- Videos engage audiences as visuals and sound immediately capture the viewer's attention, whereas a reader may overlook an article simply because of its title or length of text.
- Videos combine several methods of communication: In addition to verbal and non-verbal communication, videos can incorporate visuals that are shared in written communication (e.g. images, infographics, and text).
- Video sharing on the internet and social media platforms are widely used for sharing videos of interest in a quick, concise, and relatable way. Social video generates 12 times more shares than text and images combined (Mansfield 2019). People use video sharing to express their own professional and personal interests to others.
- Videos provide quick content as compared to reading an article which takes much longer than watching a video. Using short-format videos allows us to condense information into a few minutes.
- Videos incite action as they can be seen as a more compelling and authentic device for creating interaction. People may be more driven to act on an issue or engage with a topic if they receive a call-to-action in a professional video.
- Videos enable a more convenient and accessible production, for example, in comparison to writing a scientific article, which requires a considerable amount of time to write and is addressed only to a specific target audience of peers. By contrast, in a video, people can speak about a topic more spontaneously and informally to inspire a productive dialogue with others addressing a wider audience. However, also videos require careful planning, but it is not crucial to create a strict script, which allows for more ease in the flow of the conversation.
- Videos provide the best search engine results. By comparison, videos have a way better chance of reaching audiences who search a keyword and are 45 times more likely to rank on the first page of Google than text results (OMNICORE 2019). Pages that include videos will commonly cause Google to pull the thumbnail and present it next to the result, setting the page apart from the crowd and leading to doubling the search traffic in some cases (OMNICORE 2019).
- Videos reach the widest market as more and more people are consuming online videos through social media on YouTube, Facebook, Twitter, Instagram, or LinkedIn. According to the Ericsson Mobility Report (2019), in 2016, videos account for half of all mobile traffic and are estimated to account for 70% of all mobile traffic by 2021.
Weaknesses/Challenges:
- Poor quality videos can build a negative perception of your project: for example, 62% of consumers are likely to build a negative perception of a firm that publishes poor quality videos (Whatcott 2013). This often happens with free or cheap video editing software and websites as exporting your edited video in higher resolution is more costly.
- A production concept needs to be developed by a small but interdisciplinary team at the early planning stage involving people knowledgeable in PR, the content to be presented, interviewing, filming, video editing, social media presentations, and IT administration. Ideally, the same team produces the videos.
- Larger groups of people involved in video production can delay final results. However, multiple perspectives can increase the value of the content but can also slow down the time it takes to finalize the video; so it is important to select the team wisely.
- Mistakes caused by poor or inexperienced recording may be corrected in parts but are sometimes difficult to fix in editing. If the interviewing process is filmed in poor quality, a professional editing team can only do so much to improve it, or it will be more costly. Examples include bad lighting or sound. Fixing the lighting of the interviewee can be done, but it may be at the cost of the image in the background. If the interviewee's volume is too low, because they are far away, this can only be rectified to a certain extent and will require cutting out the interviewer if their volume is obviously much higher than that of the interviewee.
- Strategic and quick team internal communication: Poor communication with the editing team can cost more time and money. If you explain clearly to the video editing team what you expect and want in the video, it can save time and confusion with editing errors. Explain clearly the outline and vision for your video. A professional video production team can offer some suggestions on what will work for your video and what might not be feasible. Communicating on this best before the recording at least when first handling of the material will avoid confusion and too many re-edits.
Software and materials needed:
Video camera, tripod, two microphones, at least 2 camera batteries per camera, at least two memory cards (64 gigabytes) per camera, spotlight, setting with good lighting that is attractive, quiet and tidy, prepared script including questions that introduce the person and the project, background posters or photos that are visually appealing and relevant to the topic of the video and professional editing software (e.g. Adobe Premiere Pro, Final Cut Pro, Avid Media Composer).
Key references:
Contact info:
- Lindsey Chubb: lindsey.chubb@elo.org
- Carol Grossmann: carol.grossmann@forst.bwl.de
- Marie-Alice Budniok: alice.budniok@elo.org
4 Comparison of methods against the matching framework
In this section, we compare the methods portrayed in the factsheets in section 3 again against the matching framework presented in section 2 (cf. Figure 1). For doing so, we first start out with a comparison of the methods in regard to their specific resource needs in terms of data, time, special expertise, and software. We then continue with a comparison that gives particular emphasis to the suitability of the methods to contribute to the integration of different types of knowledge (aspect 2 in Figure 1, see also Figure 2), to allow for increased options of participation of multiple actors (again aspect 2 in Figure 1, see also Table 1), and to provide support across several phases of the innovation process (aspect 3 in Figure 1). Finally, we close with a comparison of the methods in regard to their ability to support different strategies for prototyping: up-grading, up-scaling, and replication (see Figure 3).
4.1 Comparison of the methods in regard to their specific resource needs
For this comparison, we assessed the different suggested methods in regard to their specific resource needs. This concerns their data demands in general (high, medium, low), what types of data are mainly used as inputs (quantitative, qualitative, or both), how time-consuming their application is, what special expertise is needed to conduct them, how easily they allow for the participation of non-experts, and if they depend on specific software which might be available for free and open source or proprietary, which means additional financial resources are necessary to buy them or secure a license.
Table 6 provides an overview of all these features.
| Methods | Data demand | Type of data needed | Time need | Expertise required | Participation options for non-experts | Software needed |
|---|---|---|---|---|---|---|
| Institutional/bio-physical mapping | high | quantitative | high | high | low | yes° |
| Role board games | high | both | high | high | high | helpful*° |
| Constructive innovation assessment | high | both | medium | high | high | no |
| Governance situation assessment | high | qualitative | medium | medium | high | helpful*° |
| Process Net-Maps | high | both | high | medium | high | helpful* |
| Qualitative comparative analysis | high | both | high | high | high | yes* |
| Agent-based modelling | high | both | high | high | low | yes* |
| Feedback sheets | medium | both | medium | low | high | no |
| Innovation region and work package Skype meetings | low | both | medium | low | high | no |
| Stakeholder interviews | high | both | high | high | high | helpful*° |
| Focus group discussions | high | qualitative | high | high | high | helpful*° |
| Stakeholder analysis | high | both | medium | medium | high | helpful* |
| Use of social media | low | both | high | low | high | no |
| Video production | high | both | high | high | high | yes*° |
| Legend: * Open source software ° Proprietary software | ||||||
The question, if methods are rather using quantitative or qualitative data might be particularly relevant. While quantitative data are better suited to provide more factual information for answering who, what, where, and when questions, by contrast, qualitative data are better suited to generate more interpretative information to answer how and why questions that are useful for a more in-depth analysis. As shown in Table 6, the majority of suggested methods allows for the collection of both types of data.
For InnoForESt, due to its dedication to a multi-actor-approach, allowing the participation of non-experts is another crucial feature. As can be seen from Table 6, the majority of suggested methods offer excellent options for including non-experts not specifically trained in the respective method.
4.2 Comparison of methods in regard to their suitability to contribute to the integration of different types of knowledge, to allow for participation of multiple actors, and to support across several phases of the innovation process
For this comparison, we refer back to the matching framework (cf. Figure 1) and look again at the different aspects considered in the framework (numbered aspects 1, 2, and 3). We then assess each method in regard to the following three aspects:
- its suitability to support the integration of WHAT knowledge type (scientific, practical, other, e.g. bureaucratic),
- its suitability to support WHICH level of participation among actors, and
- its suitability to support WHEN in the innovation process.
The results of the assessment are presented in Table 7 below.
| Methods | Supported highest participation level* | Supported knowledge integration | Supported phases in the innovation process | |||
|---|---|---|---|---|---|---|
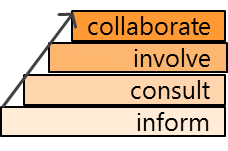 |
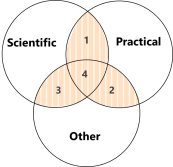 |
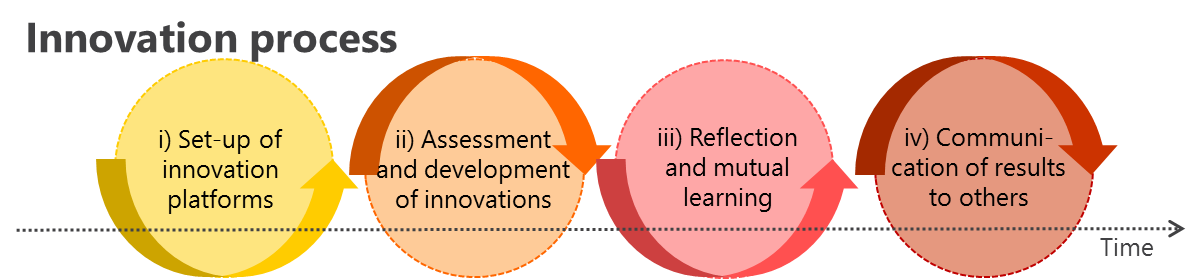 |
||||
| Institutional/bio-physical mapping | consult | scientific + bureaucratic | ||||
| Role board games | collaborate | all types | ||||
| Constructive innovation assessment | collaborate | all types | ||||
| Governance situation assessment | involve | practical + other | ||||
| Process Net-Maps | collaborate | all types | ||||
| Qualitative comparative analysis | consult | all types | ||||
| Agent-based modelling | inform | all types | ||||
| Feedback sheets | collaborate | scientific + practical | ||||
| Innovation region and work package Skype meetings | collaborate | scientific + practical | ||||
| Stakeholder interviews | involve | all types | ||||
| Focus group discussions | collaborate | all types | ||||
| Stakeholder analysis | involve | practical + bureaucratic | ||||
| Use of social media | inform | all types | ||||
| Video production | involve | all types | ||||
| *both, project-internal regarding the participation of the InnoForESt science and practice partners, as well as, project-external, regarding other stakeholders in the innovation regions | ||||||
As can be seen from Table 7, the methods complement each other rather well in regard to the different aspects. In regard to participation options, these are particularly high for the role board games, the constructive innovation assessment, Process Net-Maps, and focus groups, as well as feedback sheets and cross innovation region and work package Skype meetings. Integration of different knowledge is supported by the mix of methods at all possible interfaces:
- between scientific and practical knowledge (interface 1) corresponding to knowledge exchange and co-creation between InnoForESt science and practice partners,
- between practical and other (e.g. bureaucratic) knowledge (interface 2), corresponding to knowledge exchange between InnoForESt practice partners and other project-external stakeholders in the innovation regions, such as actors representing public authorities and political decision makers.
- between scientific and other (e.g. bureaucratic) knowledge, corresponding to knowledge exchange between InnoForESt science partners and again other project-external stakeholders in the innovation regions like governmental actors, and
- between all three types of knowledge, scientific, practical and other, corresponding to knowledge exchange between InnoForESt science and practice partners and other project-external stakeholders in the innovation regions.
Also the mix of different methods corresponds well with providing support across the different phases i)-iv) in the innovation process.
4.3 Comparison of methods in regard to their ability to support the different strategies for prototyping: up-grading, up-scaling, and replication
For this comparison we refer back to the three strategies of prototyping outlined in section 2 (see Figure 3) and we assess each method in view of how supportive it can be to assist in:
- Up-grading, which refers to further developing and improving the existing innovation within the original geographical area and context, but with a wider scope (e.g. by considering additional forest ecosystem services, improving the quality of the provided services and related products, and improving marketing strategies to attract further customers).
- Up-scaling, which refers to transferring an existing innovation with the initial scope to an extended geographical area or higher administrative scale, still including the original region and context (e.g. by raising demand for the provided forest ecosystem services and related products beyond the original area, engaging additional stakeholders with similar interests to increase the supply, and including additional forest ecosystem services from another area to create a wider portfolio of offered services).
- Replication, which refers to making an innovation transferable and applicable for a different region and under different context settings, also adjusting the scope as preferred by the new network of actors (e.g. by designing communication measures to make others aware of the original innovation in order to make them think about copying and transferring it to their own region, providing guidance and advice to the new set of actors on how to adapt it to their specific context conditions in case it cannot be copied one-to-one, and replicating a funding mechanism for a new forest ecosystem service in the new area)
Table 8 presents the outcome of the assessment.
| Methods | Up-grading | Up-scaling | Replication |
|---|---|---|---|
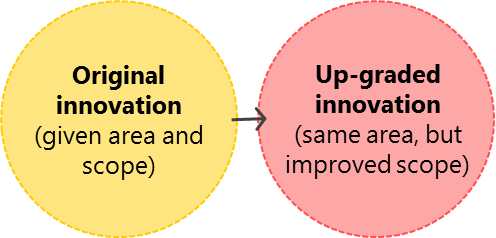 |
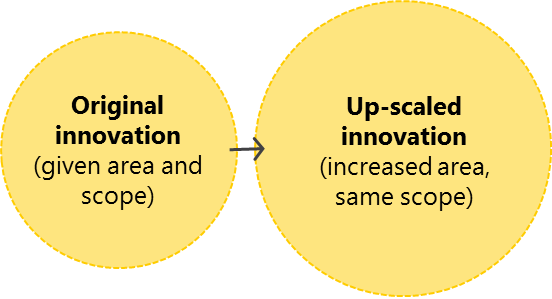 |
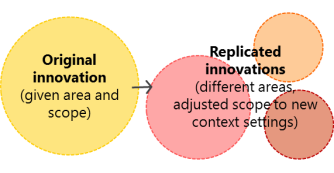 |
|
| Institutional/bio-physical mapping | |||
| Role board games | |||
| Constructive innovation assessment | |||
| Governance situation assessment | |||
| Process Net-Maps | |||
| Qualitative comparative analysis | |||
| Agent-based modelling | |||
| Feedback sheets | |||
| Innovation region and work package Skype meetings | |||
| Stakeholder interviews | |||
| Focus group discussions | |||
| Stakeholder analysis | |||
| Use of social media | |||
| Video production | |||
| Legend: | |||
| = high suitability | |||
| = medium suitability | |||
| = low suitability | |||
| = no suitability | |||
5 Experiences from the application of the methods in the six InnoForESt innovation regions
This section of D4.1 is particularly dedicated to highlighting the experiences with the application of different methods from the perspective of the innovation teams in InnoForESt and how – in their opinion – they helped in supporting in the further development of their specific innovations and prototype development.
For the compilation of this section, all InnoForESt innovation teams were invited to provide input. Thereby, the innovations teams were free to decide for which method/s they wanted to provide input and also on how many methods. For all sub-sections, the respective authors are specified, always making reference to the individual InnoForESt innovation regions.
For an overview of which methods were applied in which innovation region as of yet, please see Table 9 below.
| Methods | Austria | Finland | Germany | Italy | Slovakia/ Czech Republic |
Sweden | |
|---|---|---|---|---|---|---|---|
| Institutional/bio-physical mapping | ✔ | ✔ | ✔ | ✔ | ✔ | ✔ | |
| Role board games | ★ | ✔ | + | + | ✔ | ✔ | |
| Constructive innovation assessment | ✔ | ✔ | ✔ | ✔ | ✔ | ✔ | |
| Governance situation assessment | ✔ | ✔ | ✔ | ✔ | ✔ | ✔ | |
| Process Net-Maps | ★ | ✔ | ✔ | + | ✔ ✱ | ✔ | |
| Qualitative comparative analysis | ★ | ★ | ★ | ★ | ★ | ★ | |
| Agent-based modelling | ? | ? | ? | ? | ? | ? | |
| Feedback sheets | ✔ | ✔ | ✔ | ✔ | ✔ | ✔ | |
| Innovation region/WP Skype meetings | ✔ | ✔ | ✔ | ✔ | ✔ | ✔ | |
| Stakeholder interviews | ✔ | ✔ | ✔ | ✔ | ✔ | ✔ | |
| Focus group discussions | ✔ | ✔ | ✔ | ✔ | ✔ | ||
| Stakeholder analysis | ✔ | ✔ | ✔ | ✔ | ✔ | ✔ | |
| Use of social media | ✔ | ✔ | ✔ | ✔ | ✔ | ✔ | |
| Video production | ✔ | ✔ | ✔ | ✔ | ✔ | ✔ | |
| Legend: | |||||||
| ✔ | = method already applied | ||||||
| + | = method application currently planned | ||||||
| ★ | = method application currently considered, but still uncertain | ||||||
| ? | = method application currently unassured | ||||||
| ✱ | = method application was altered and specifically adapted to the needs of the innovation region | ||||||
- Institutional and bio-physical mapping (WP2): see Primmer et al. 2018 (InnoForESt deliverable D2.1)
- Constructive innovation assessment (WP4), as well as stakeholder analysis and governance situation assessment (WP5): see Aukes et al. 2019 (InnoForESt deliverables D5.1) and Schleyer et al. 2018 (InnoForESt deliverable D5.2)
- Furthermore, an additional deliverable has been dedicated to exploring the different prototyping strategies up-grading, up-scaling, and replication for the different innovation regions (see Maier et al. 2019, InnoForESt deliverable D6.2).
All these deliverables are listed in the reference section.
5.1 Experience from Austria
Method: Stakeholder analysis
Authors: Jutta Kister, Michael Klingler and Christian Schleyer
The aim of the stakeholder analysis in the Austrian innovation region Eisenwurzen was, first, to gather information about the stakeholders of the innovation region, which are relevant for the innovations intended. Further, it was also used to support the aim to build up a broad cross-sectoral network of innovative collaboration in order to improve the sustainable use of forest and wood related resources with increased benefits for the region and the people living and working there. The region has a very high share of forests (>80%) and protected areas are of great importance. Like many other comparable rural regions, it is confronted with increasing out-migration.
Thus, we collected information using these guiding main questions:
- Who are the relevant stakeholders? Who has a stake in forest and wood-related economic activities (e.g. stakeholders located in the region and also those invested in regional and national capital – to make sure not to overlook stakeholders that may be important contributors to the innovation network)?
- What are their interests, visions and concerns (related to forest and wood-related economic activities or regional development strategies)?
- How are these stakeholders interlinked? Are there existing networks of co-operation?
- Which stakeholders are open to innovation and who is blocking innovation? What are constraints and options?
After consulting the available written information on the region and some stakeholders from former relevant projects, policy documents, websites, etc., we applied qualitative survey methods, semi-structured interviews to be precise, as they are used frequently in human geography and other social sciences. Interviews were taking place on the workplace of the interviewed person(s). We developed a set of open questions, which were relevant for all types of stakeholders, but added interviewee-specific questions if appropriate. The 15 interviews usually lasted about one hour or longer, mostly with one interviewee, in some cases with more than one stakeholder (up to three). By using semi-structured interviews with key stakeholders, we were also able to directly address potential participants, to inform them about InnoForESt, to explore their motivation to join the innovation activities, and thus to (potentially) integrate a larger diversity of actors in the innovation network. In doing so, we reckon that we indeed increased attention regarding upcoming InnoForESt innovation activities.
Through the integrated perspective on the entire regional wood and forest-related commodity chain, the stakeholder analysis offers a high degree of added value for the region itself, especially for regional planning, local policy making processes, and the forest farmers' association (representing small-scale forest owners). .
In order to identify the relevant interviewees we:
- Created a collection of potential addressees together with our local practice partner, discussed characteristics, sorted them according to categories, and prioritized them. We aimed to do at least one interview per stakeholder category. We further intended to ensure a certain regional distribution as the region is divided into several political and administrative districts, and
- Integrated other stakeholders that were mentioned in the interviews (snowball system) and prioritized them when they were mentioned more often.
The audio files of the interviews were transcribed and analyzed by using codes (using MAXQDA software) based on the analytical categories in the interview guideline. These codes helped us to structure the text and (re)connect information to the main questions listed above.
After a general introduction presenting the general aims and scope of the InnoForESt project, pointing out why we chose 'Eisenwurzen' as an innovation region, explaining what we wanted to achieve with the interview and how we plan to do the data analysis, we developed a guideline of open-ended questions that structured the interviews in the following way:
- Please present yourself, your institution and your tasks.
- What do you consider the main challenges and opportunities in the topic of forest management and industry as well as regional value creation?
- Are you / is your institution involved in activities or projects in this topic or have you been involved in the past? (Which one? With whom? Describe experiences? Your motivation?)
- Do you know about other projects, ideas, concepts dealing with forest, forestry, wood processing or value creation out of wood that are taking place / took place in the region? (Which one do you think are promising? Why? How do these support local value creation? What is missing to these initiatives to get more successful? How to support?)
- What exactly do you consider 'innovative' about these mentioned projects / ideas / initiatives?
- With regard to the region: which areas do you consider in need for innovative development (related to forestry, wood processing …)? (Largest potentials for innovation? Potentials to implement innovations? What hinders? Difficulties?)
- Which persons, institutions, and networks do you know, that drive innovative ideas forward? Who is important bringing change and innovation to the region? What is this person, institution or network contributing? Resources, contacts, integrative capabilities, that this person (…) consists of?
- How do you consider your role in this topic?
The stakeholders we interviewed were assigned to different stakeholder categories. By doing so, we could check, if we were addressing all relevant stakeholder categories to prevent the exclusion of stakeholders that might be of importance for improving the respective innovation. We also assessed which stakeholder categories are of more or less importance to our innovation region, and which are not (yet). Over the project duration, we want to keep on monitoring the stakeholder constellation, if this picture is potentially changing (new stakeholders may be included, stakeholders involve themselves into innovation process, etc.).
Table 10 provides a most up-to-date overview of which categories of stakeholders are currently involved in the further development of our innovation.
| Stakeholder category | Concrete stakeholders in the innovation region |
|---|---|
| Protected areas organizations | National Park ‚Gesäuse', National Park ‚Kalkalpen' |
| Public administration | Federal Environment Agency, LTSER-Administration, Deputy of National Assembly (out of the region), local public administration |
| Municipalities | Mayors (Steinbach / Steyr, Steinbach / Ziehberg) |
| Cooperation network and consulting cluster | MHC Möbel- und Holzcluster OÖ, SPES Zukunftsakademie, Biomass Association Upper Austria |
| Smaller businesses (SME) | Carpenter (furniture and construction), Wood trader, Sawmill, Forest Office, Wood designer |
| Federation of forest-/ wood- related companies | Local Chamber of Commerce, Local Chamber of Agriculture |
| Forest owners | Forest Farmers Association (also representing small-scale forest owners), Monasteries, Styrian state forests,… |
| Regional development agency | Regional management agents (several sub-regions) |
| Practice partner InnoForESt | STUDIA (local practice partner) |
| Science partner InnoForESt | University of Innsbruck |
5.2 Experience from Finland
Method: Role board games
Authors: Veronika Gezik and Liisa Varuumo
The first role board game in InnoForESt was set up for the Finnish innovation region and was conducted in Turku, Finland on June 18, 2019. The session in Turku intended to create a situation in which a group of five players took on the roles of different ecosystem services users and providers who made decisions about the use and management of forest ecosystems. During the single rounds of the game the participants then were confronted with fostering or hindering context conditions (e.g. in regard to a change in the local climate or change in policy and governance). Thereby, the participants of the game had different interests based on our assigned roles. During the game and through repeated interactions, the participants were able to explore which decisions led to a more successful collaboration for the sustainable management of our forest ecosystem services under specific contextual conditions which were close to the real conditions in our innovation region. The game created a space to test certain ideas for prototype development. Thereby, it was distinguished between two stages: In a first stage, it was considered that there was no governance innovation in place. In the second stage, several novel payment schemes for biodiversity conservation, in which governance actors degrading biodiversity compensate the loss they generate by buying offsets from landowners who restore and/or protect sites as offsets, were available as possible development pathways for our innovation. After the game, the participants were invited to a focus group discussion to consider main findings and implications for our region. Results from the game will be used for prototype development and further planning of innovation activities in the Finnish innovation region.
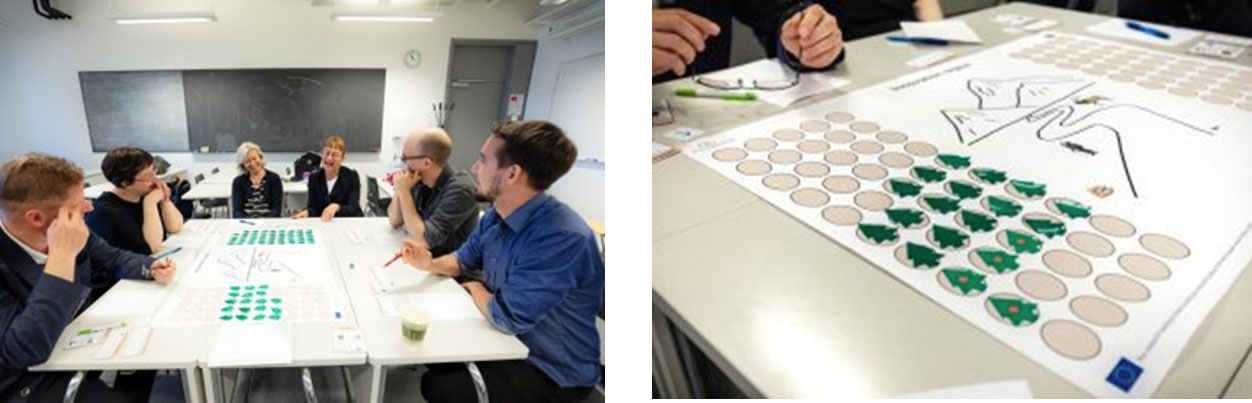
5.3 Experience from Germany
Method: Constructive innovation assessment
Authors: Peter Adolphi and Claas Meyer
Within the German innovation region 'Waldaktie', two whole-day CINA workshops have already been conducted up until now for scenario and prototype development. The first workshop was held on March 6, 2019 and the second one on July 3, 2019. The central topic of both workshops was the discussion of different scenarios leading to the further development of our innovation into what we call 'Waldaktie 2.0'. Therefore, we considered several pathways for prototyping combining both the up-grading and up-scaling strategy. Workshop participants included a small group of stakeholders (around 10) who were either the founders of the original Waldaktie innovation (owners of the idea) or very much involved with the Waldaktie implementation. Further participants included team members from InnoForESt work packages WP4, WP5, and WP6. The small setting was deliberately chosen and seen as very important to start the development process based on the high level of trust already established among the involved stakeholders. The atmosphere was very relaxed, mostly with a long history together. In the first workshop, in particular, opinions of all involved Waldaktie stakeholder on the future development of the innovation were collected and first ideas on different directions for further development pathways were discussed. Based on this, more specific prototyping scenarios were prepared for the second workshop, circulated in advance for feedback and further refinement. The results of the second workshop will be the basis for a third workshop aiming to allow for concrete decisions on the direction of the further development of the innovation. This will then form the basis to conduct a fourth workshop dedicated entirely to prototype development. The development is progressing well and promising with ample support from all stakeholders. The two workshops already completed also included discussions on possible collaboration and exchange of ideas with other innovation regions in InnoForESt. Of particular interest for the German innovation team is the collaboration with the Finish innovation team working on the idea of implementing a habitat bank at the national level. With them mutual work could be done on the question of how forest ecosystems services can best be quantified. Also, the Czech/Slovakian innovation region is of high interest for the Waldaktie innovation, especially in regard to designing 'forest shares'. Furthermore, in both workshops already completed a reflection took place on the specific role of being chosen as an innovation region for InnoForESt and the different demands that go along with it, for example, in regard of the challenge of getting things done on the ground and at the same time setting aside enough time to allow for 'being studied' by the science partners. However, generally mutual benefits have been acknowledged, such as methodological support from the researchers in the project, knowledge gained from studying other innovation regions, increase in profile through publications, media presence, and the EU-project status of InnoForESt.
5.4 Experience from Italy
Method: Stakeholder interviews 'on-the-job'
Authors: Caterina Gagliano and Ruggero Alberti
Interviews are very time consuming for stakeholders. Nevertheless, in the Italian innovation region there was a very strong commitment among stakeholders to be available for interviews and share perspectives on the innovation development based on professional experience and local knowledge. However, to make it easier for the stakeholders, we decided to travel to the innovation region and conduct 'on-the-job' interviews with stakeholders in their workplaces. This allowed us to respect their working hours and to guarantee a more familiar environment when conducting the interviews. We adapted our interview setting directly to the type of work done. For instance, representatives of municipalities and the tourism sector were interviewed in their offices or directly in the hotel where they work. By contrast, stakeholders involved in logging and harvesting trees were interviewed outside, directly in the forest (see Figure 13 for an example). We were also rather flexible and for similar stakeholders with good relations to each other and similar management problems, we organized small group interviews (e.g. within their municipality). We also interviewed some stakeholders during their work breaks so that there was no interference with their work routines and we had the opportunity to share a moment of relaxation. Not once we had to ask a stakeholder to travel outside the boundaries of their municipality. Meeting them at work (in the woods, in the hotel, in the office) is like meeting them at home!
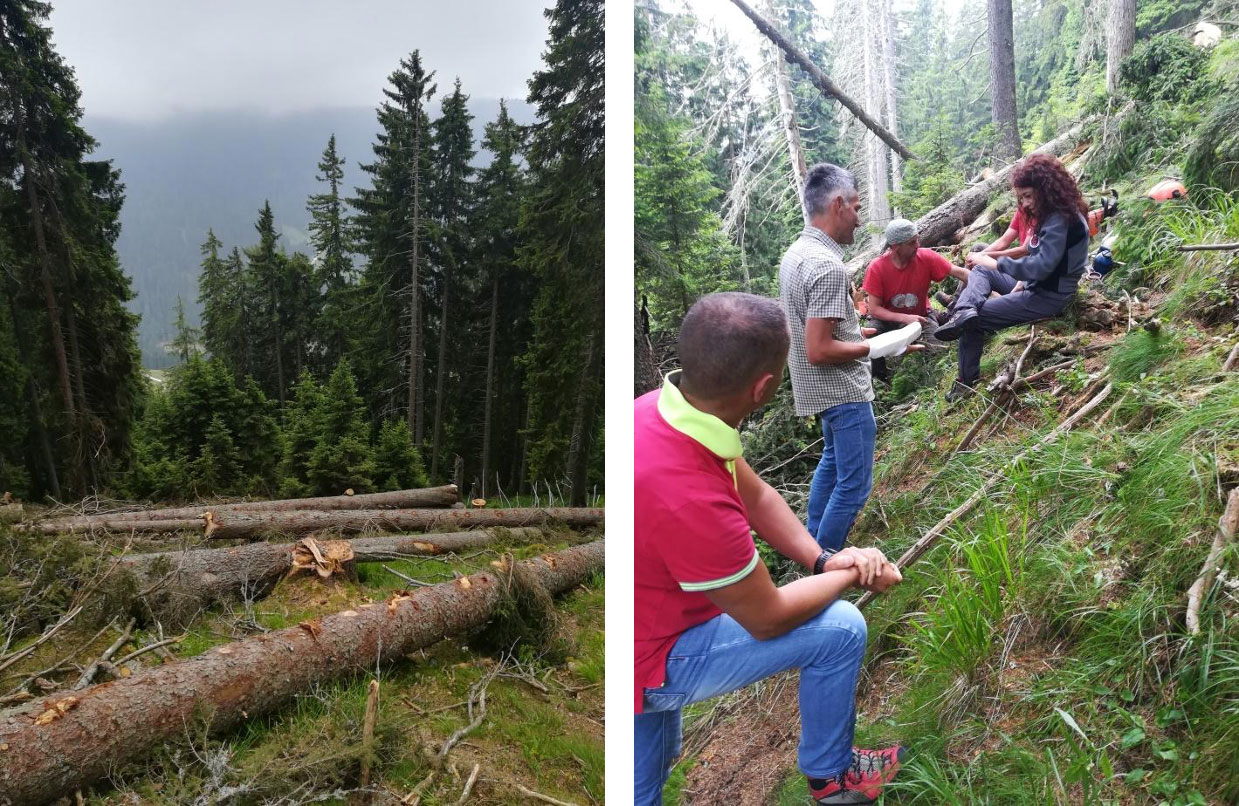
5.5 Experience from Slovakia/Czech Republic
Method: Process Net-Mapping: From history towards future plans
Authors: Lenka Dubova, Martin Spacek, Jiri Louda and Tatiana Kluvankova
Process Net-mapping was an important starting point for the further analysis of the innovation regions in Slovakia and the Czech Republic. This analysis involved creating a timeline of the main events in the innovation region in Slovakia. The analysis took place during the first CINA workshop in Urbar Hybe (Date). As part of the discussion, four representatives of the Forest commons Hybe described the development of their important organization activities in order to identify key milestones of the innovation region. They started from the past, progressed toward the current situation and continued with the future expectations. They were able to identify also future potential threats and challenges for their innovation region. The same activity was a part of a program of the focus group held in Land Trust Cmelak, Liberec (Date). Created timelines (see Figure 14) of each Forest commons helped us to identify also key stakeholders and key motivations of representatives behind their activities. The creation of the timelines during the face-to-face interviews allowed us to have complementary questions. All these information, including milestones, key stakeholders directly or indirectly involved, as well as motivational factors are crucial for the development of future scenarios and prototyping.
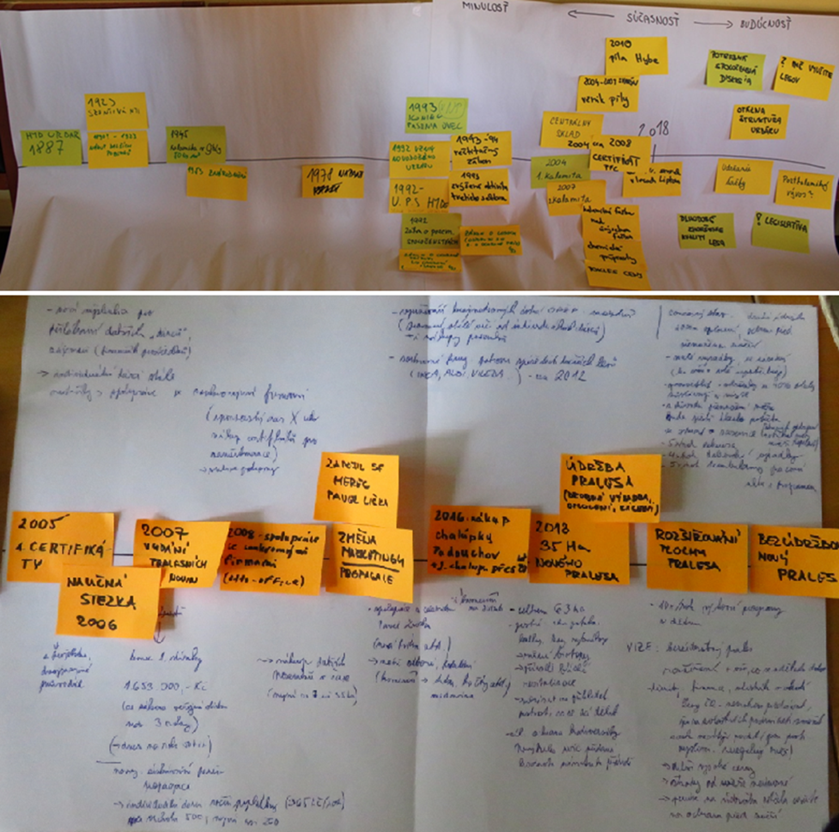
Method: Role Board Games
Authors: Martin Spacek, Veronika Gezik, Tatiana Kluvankova, Jiri Louda and Lenka Dubova
In August 2019, there was a special opportunity to conduct the InnoForESt role board game with a wider range of stakeholders from both the Czech and the Slovakian innovation region. The meeting took place in Velke Karlovcie (Czech municipality on the Czech and Slovakian border). A group of 12 stakeholders, including forest owners, representatives of the municipalities, nature protection organizations and local entrepreneurs, took part in two treatments of the game, which focused on the roles of different forest ecosystem services and their management (the main focus being on biodiversity). During the game, there was a lively discussion about the best strategy to manage the forest in both groups and there was an opportunity to test a novel payment scheme for sustainable forest ecosystem provision and protection of biodiversity. The two groups achieved completely different results: the first one followed a rather private strategy, which resulted in a fast degradation of the forest, while the second one was able to develop their own cooperative strategy which resulted in the preservation of a substantial part of the forest. After the game, players were confronted with the results and discussion in a merged focus group. Stakeholders discussed their motivations and differences between game and reality. It enables them to identify key factors which are important for the innovation development and for further prototype development.
Additional role board games with other stakeholders closer to the Czech and Slovak innovation regions will follow soon.
5.6 Experience from Sweden
Method: Focus groups
Authors: Christa Thörn-Lindhe, Sean Goodwin, Sara Brogaard, and Torsten Krause
In order to gain a better understanding of the most important stakeholder group of the Swedish innovation 'Love the Forest', the participating schools students', as well as their perspectives on forests ecosystem services and their behavior in forests, a thematic analysis was undertaken with students from two participating schools. The demographic focus of the study was hence limited to primary school students aged 10-12 years in the Gothenburg area of Western Sweden.
To do so, we conducted several follow-up focus group sessions with consenting schools to validate and further contextualize data collected through surveys that students had filled in when they were starting the 'Love the Forest' school project. Schools participating in 'Love the Forest' were contacted to gauge interest in taking part in the focus groups, which resulted in two schools being chosen via self-selection. In the following, participating schools are labelled school 1 and school 2 with 23 and 19 students, respectively.
The two classes were each divided into three groups via a game in order to randomize the groups and avoid bias through friendship interactions and unbalanced gender distribution.
The first activity was a drawing activity (see Figure 15), where students were asked to draw the activities they like to do in forests, while also writing down how they feel as a result of doing them.

The observations were then grouped into the following themes (see Table 11).
| School 1 | School 2 |
|---|---|
| Fear Finding different animals, trees, and flowers Playing games, climbing, and walking Recognition of the importance of the interconnectedness between species Aesthetic appreciation Building huts and other things from forest materials Getting fresh air Relaxing Escaping |
Excitement and adventure Feeling happy, relaxed, and free General sense of comfort and belonging Finding different animals, trees, and flowers Feeling connected to the landscape Playing games, climbing, and walking Recognition of the importance of the interconnectedness between species Building huts and other things from forest materials Picking berries and mushrooms Escaping |
The psychological benefits of these activities in terms of well-being were clear, as students connect these experiences as enabling them to relax, escape from their everyday lives, and be themselves. They also showed a certain knowledge of and respect for what the forest signified as an ecosystem.
However, several unexpected themes also arose out of the data. There was a stark difference in the attitude shown towards the forest between the first and second school: the first school took a much more negative and anxious approach towards being in the forest.
Further discussions were held with teachers after the activities which provided some insight. They suggested several socio-cultural reasons why this might be the case. The demographic of school 1 was predominantly 'new Swedes', where the children and their parents were most often refugees from Syria and Somalia (no students with this kind of background were present in the activities with school 2). Parents more than likely discouraged their children from interacting with the forest owing to the challenging situations in the countries that they fled from, often torn by war and civil unrest.
The second activity then asked students to select the six most important forest ecosystem services that forests provide to Sweden. This was done by asking students from both schools to collectively select six of the most important services to Sweden. Dummy answers, such as playing video games, were also included to see if students genuinely valued activities involving forests over other activities. Generally, students discussed very heartily and democratically how these six should be chosen (see Figure 16).
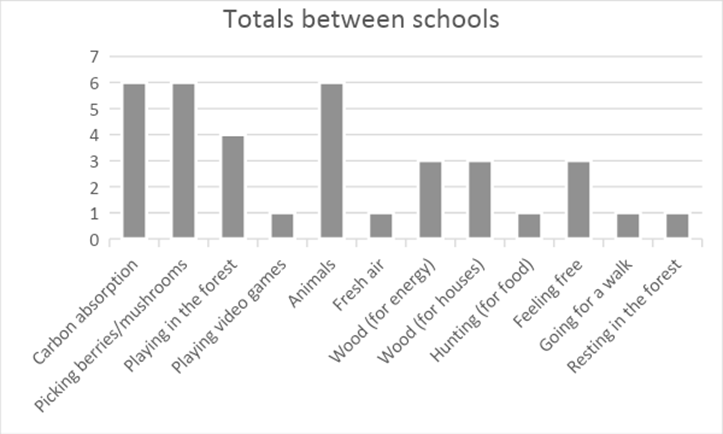
As can be seen from Table 11, all students (from both schools) identified carbon absorption, the picking of berries/mushrooms, and the importance of the forest for animals as one of the six choices. It is interesting to note that students in both schools identified picking berries and mushrooms as an important activity, even though the attitudes of the students in both schools towards actually being in forests differed: While many students from school 2 admitted to actually undertaking this activity, many from school 1 rather acknowledged that this was an activity they recognized could be done within forests, but admitted that they did not often do it themselves, if at all.
High interest was also reflected in activities involving play and those that elicit feelings of being free, as well as providing wood for fibers and energy. Only one group selected the dummy option (video games) which indicates that the students were mostly interested in engagement with forest ecosystems over other activities.
Some photo impressions from different exercises conducted with the students during the focus groups are included in Figure 17.
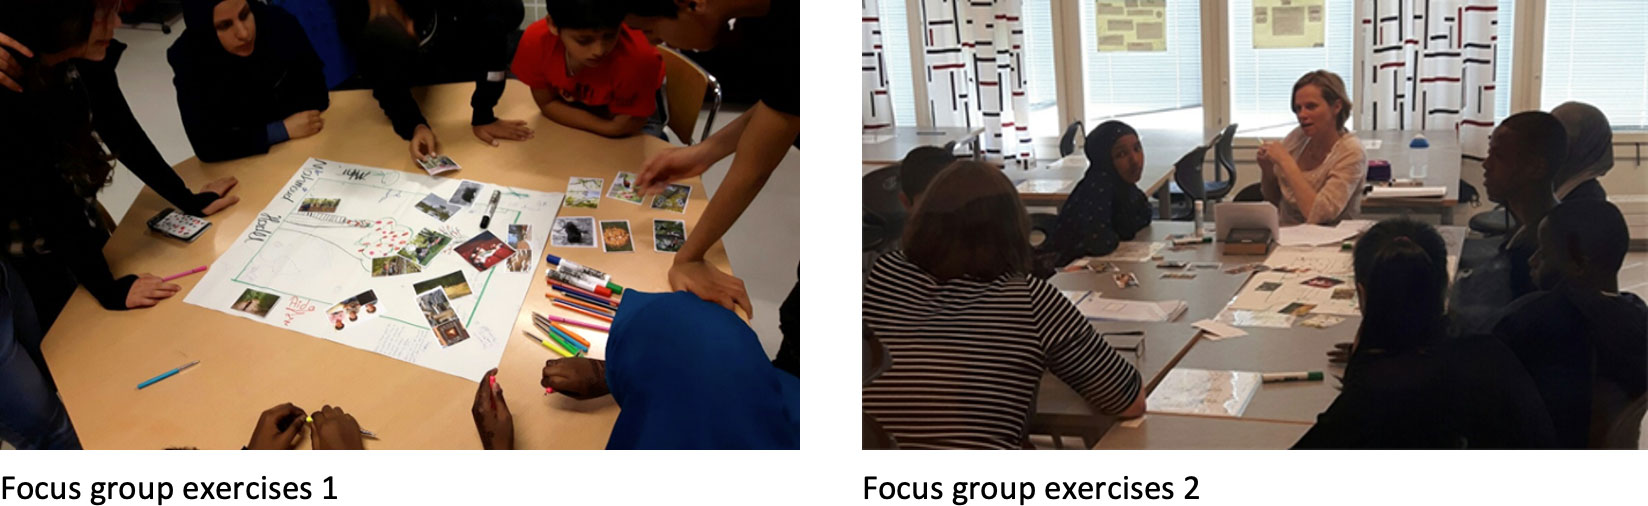
6 Concluding remarks
At this point in time, October 2019 (project month 24 out of 36), with another 12 months ahead of the InnoForESt team, not all the methods portrayed in this deliverable D4.1 have actually been applied in the innovation regions, yet (see Table 9). This concerns in particular agent based modeling and comparative qualitative analysis. This is owed to the fact that the work packages suggested a broader array of methods for application in the innovation regions, but it was the final choice of the innovation teams which methods actually get implemented. However, for some methods, such as stakeholder analysis, constructive innovation assessment (CINA), or governance situation assessment (GSA), the agreement was made early on in the project, that these methods were to be applied for all innovation regions. By contrast, other methods, such as agent-based modeling and qualitative comparative analysis were meant as suggestions by the different work packages from which the innovation teams could still chose the ones which they thought would be most helpful. In view of the multi-actor-approach, maintaining a certain degree of flexibility ensures that applied methods and obtained results are really useful in informing the further development of the different innovations and the development of prototypes.